.png)
This feature is available in QAlity Plus - Test Management for Jira exclusively.
It’s possible to visualize test execution reports based on test case executions’ statuses and users that are assigned to the test case executions.
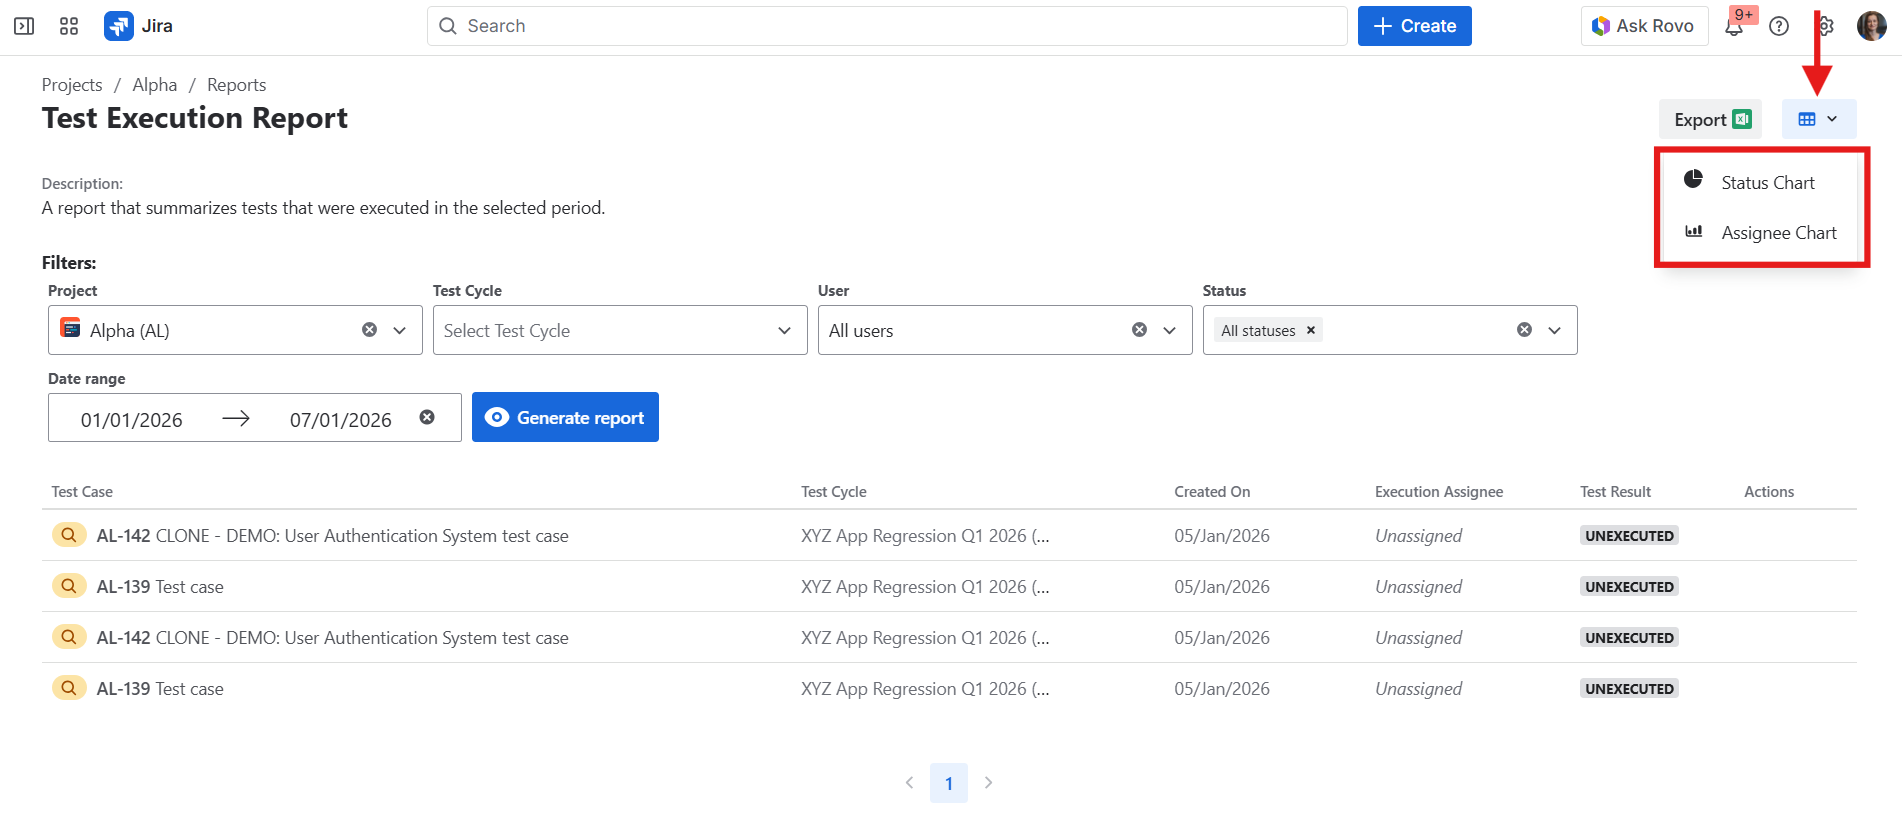
To view the charts, click the button with the table icon and select the desired data visualization.
Status Chart
This feature is available in QAlity Plus - Test Management for Jira exclusively.
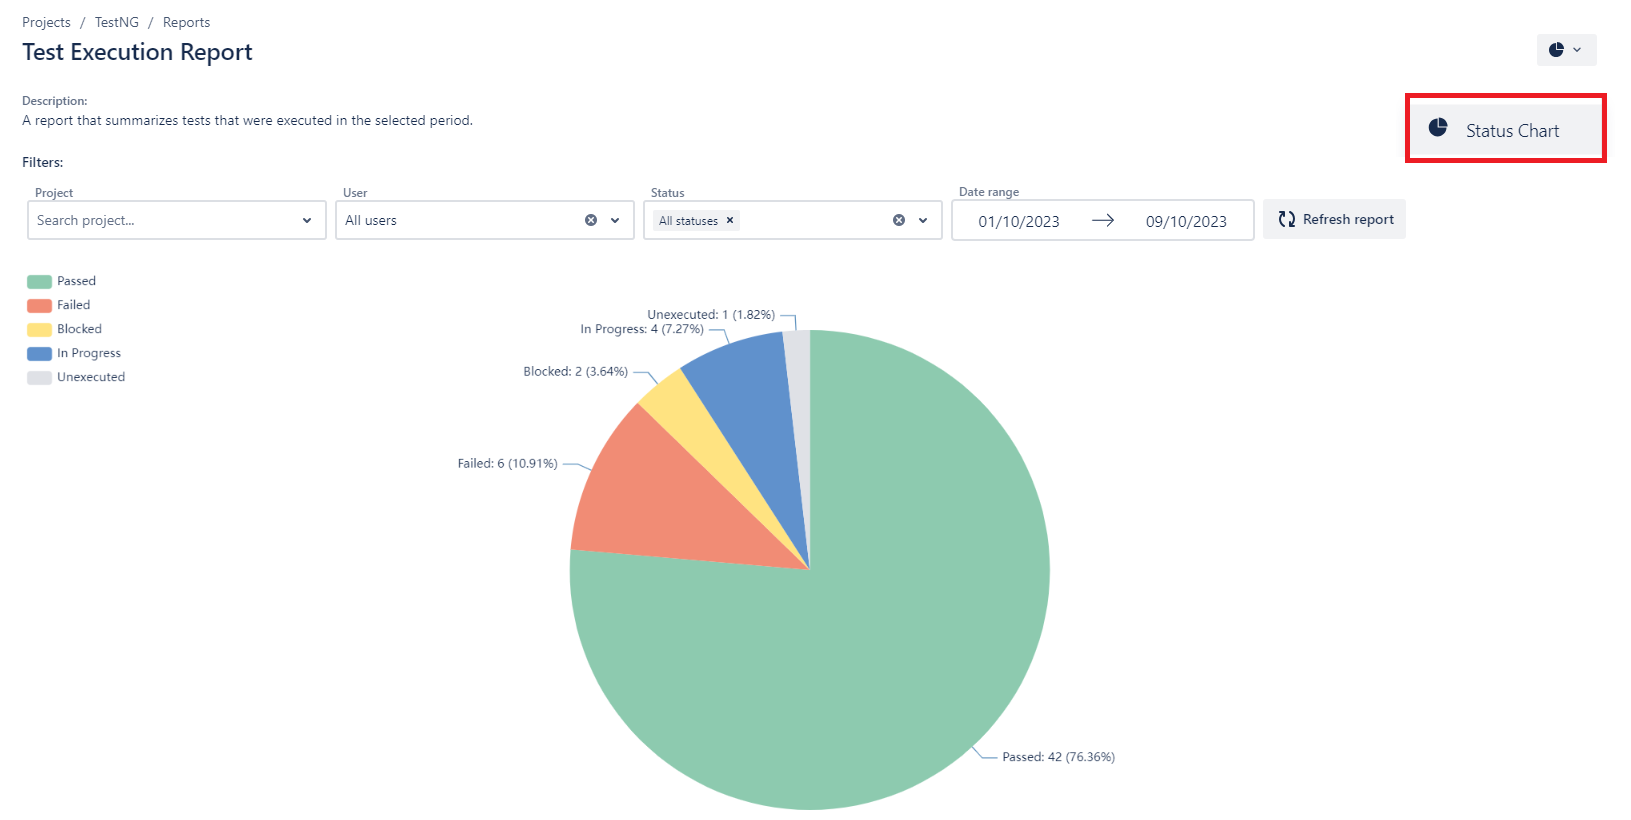
You can display your test executions in the form of a Status Chart.
Assignee Chart
This feature is available in QAlity Plus - Test Management for Jira exclusively.
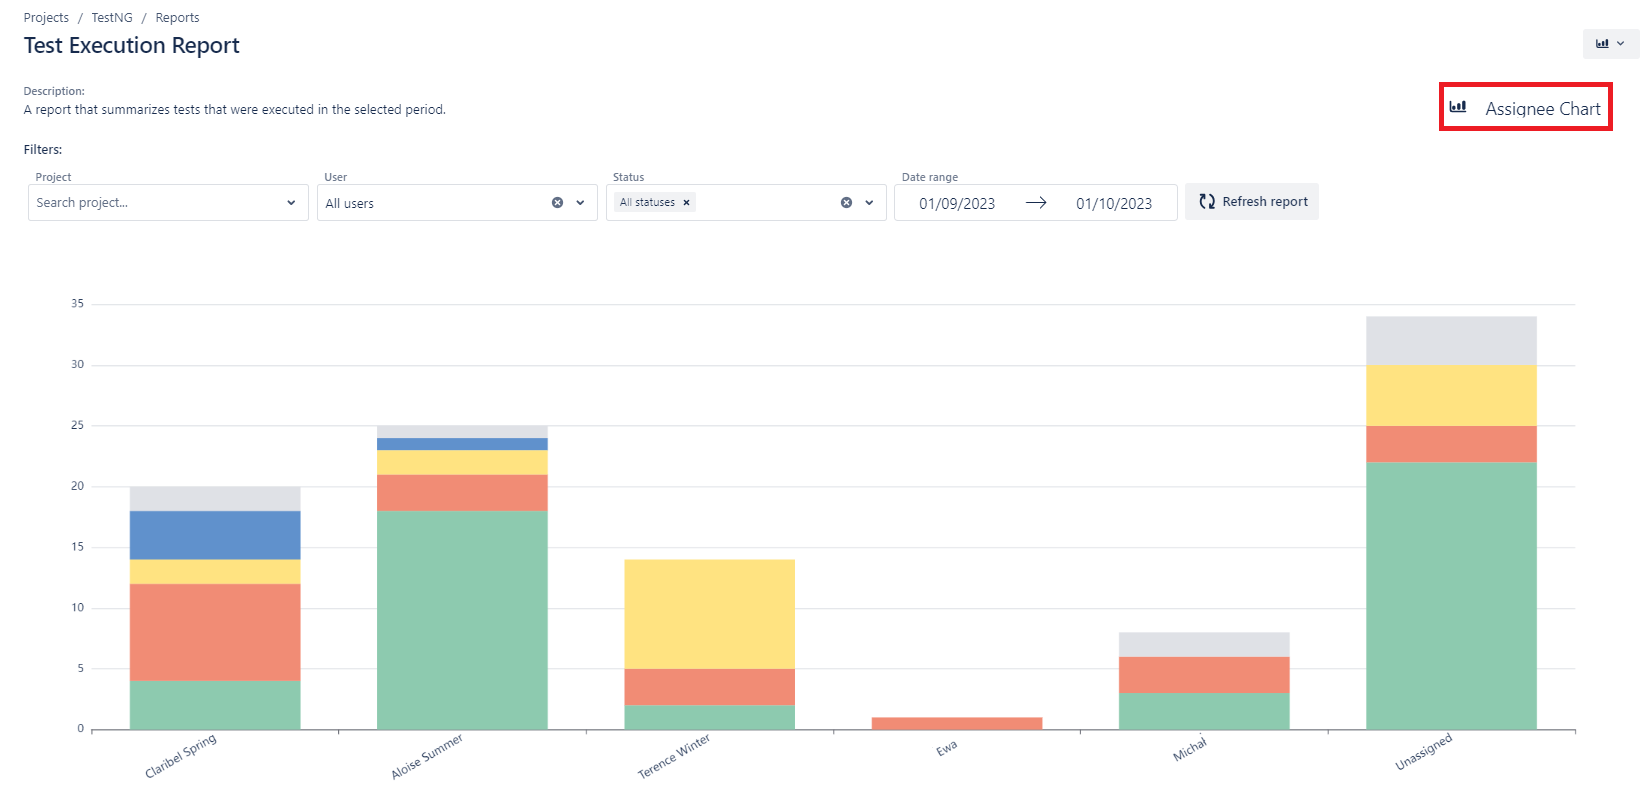
With the Assignee Chart, you can see how your users are doing with their executions per status compared with others.
Do you have any questions or feedback? Feel free to contact us here 💡