.png)
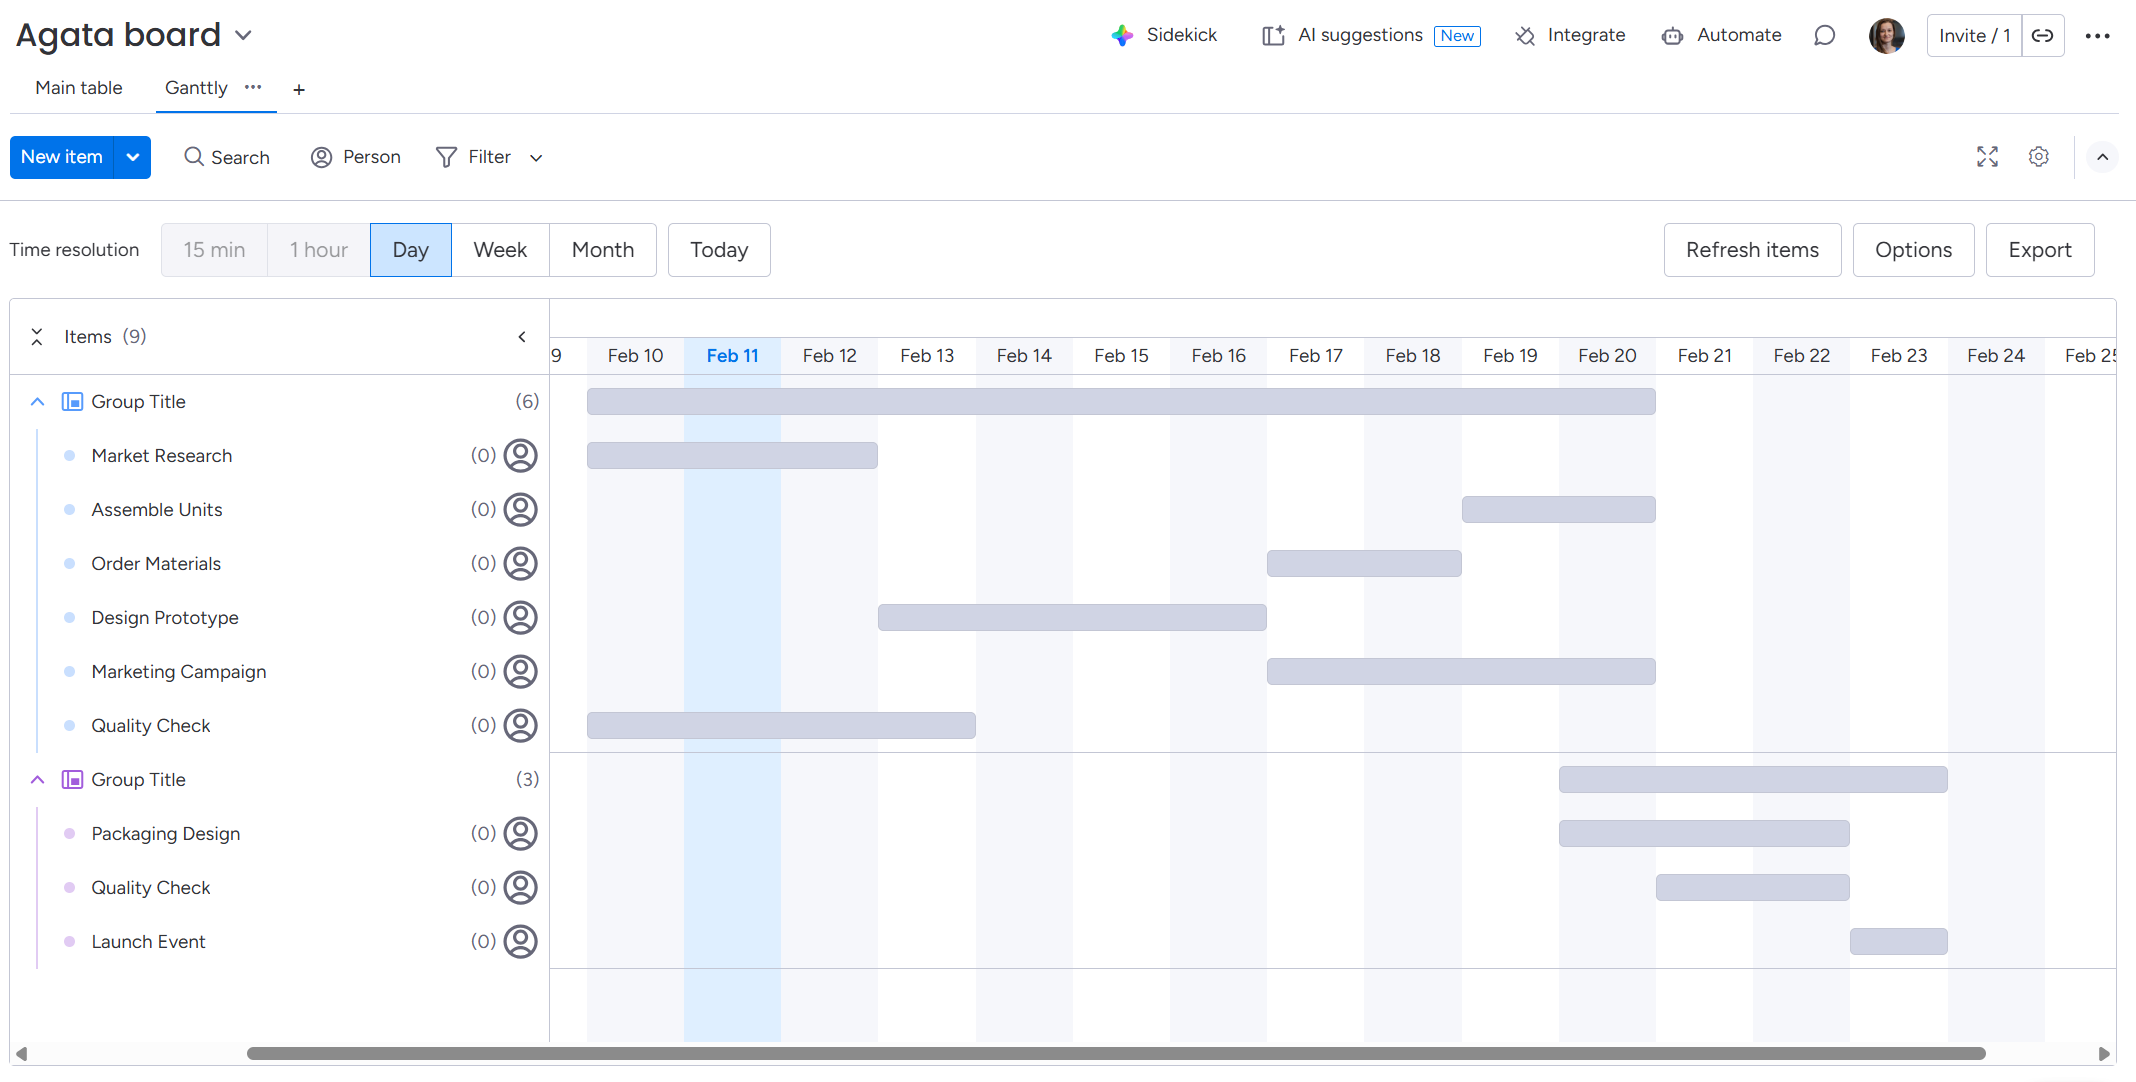
Ganttly lets you turn your monday.com boards into clear, interactive Gantt charts. When you install Ganttly, you’ll first see the intro page.
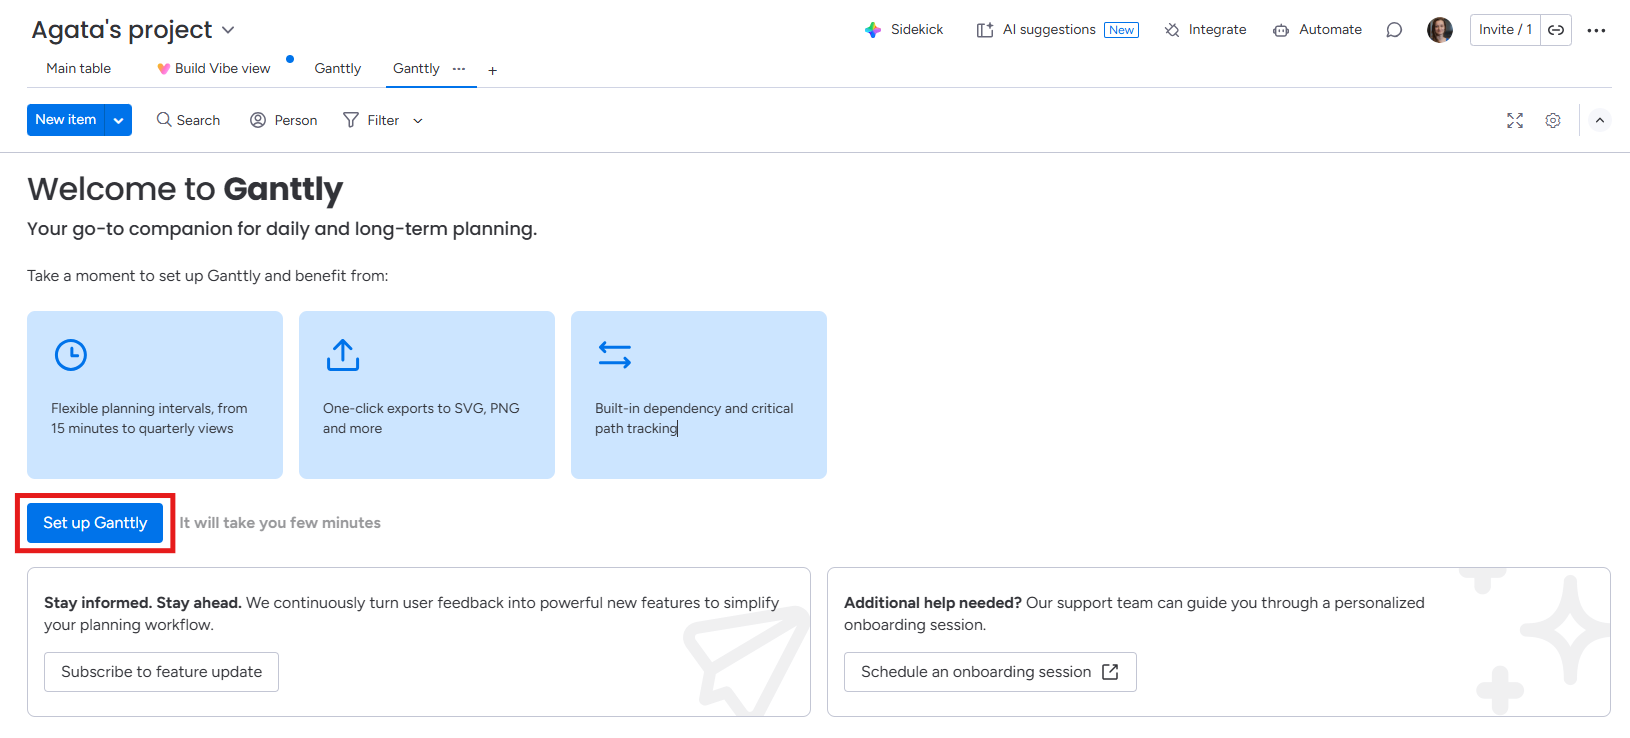
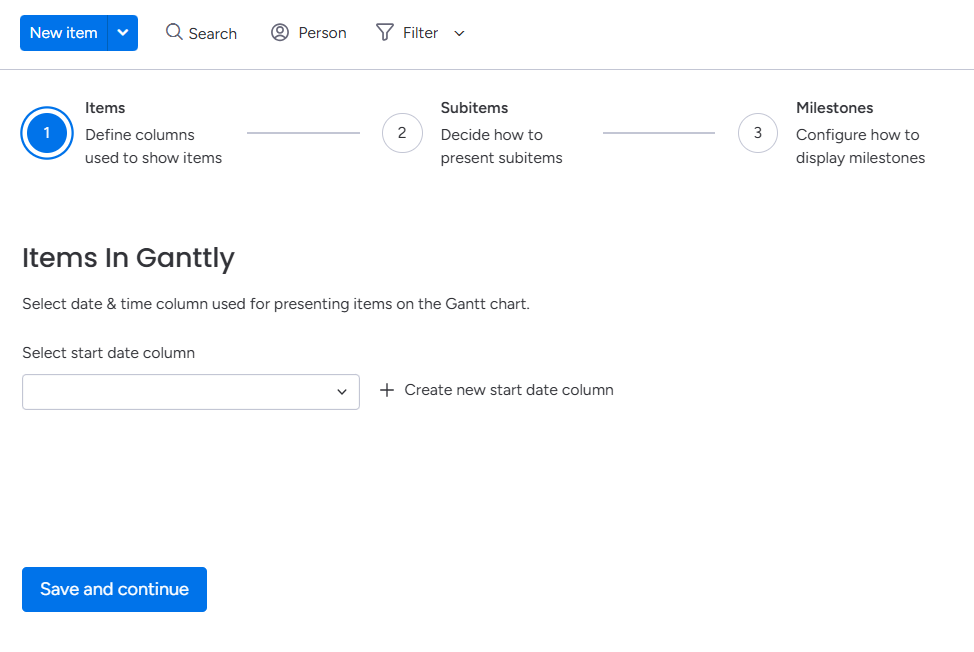
On clicking Set up Ganttly, you will be taken to the column mapping screen. From here, you can select existing Date or Timeline columns from your board to build your chart or create new ones instantly.
Data requirements
-
Make sure each item or subitem has valid start and end dates in the mapped columns - otherwise, it won’t show up on the chart.
-
Gantlly can show both dates and times if your Date columns include hours.
-
Currently, Ganttly supports only classic monday.com boards. Support for multi-level boards is coming soon.
Adding columns
To visualize your project in Ganttly, your board must have date or timeline columns configured. The app supports both individual Date columns (one for start and one for end) and the Timeline column (a single column for a date range). You can add these columns to your board in two ways:
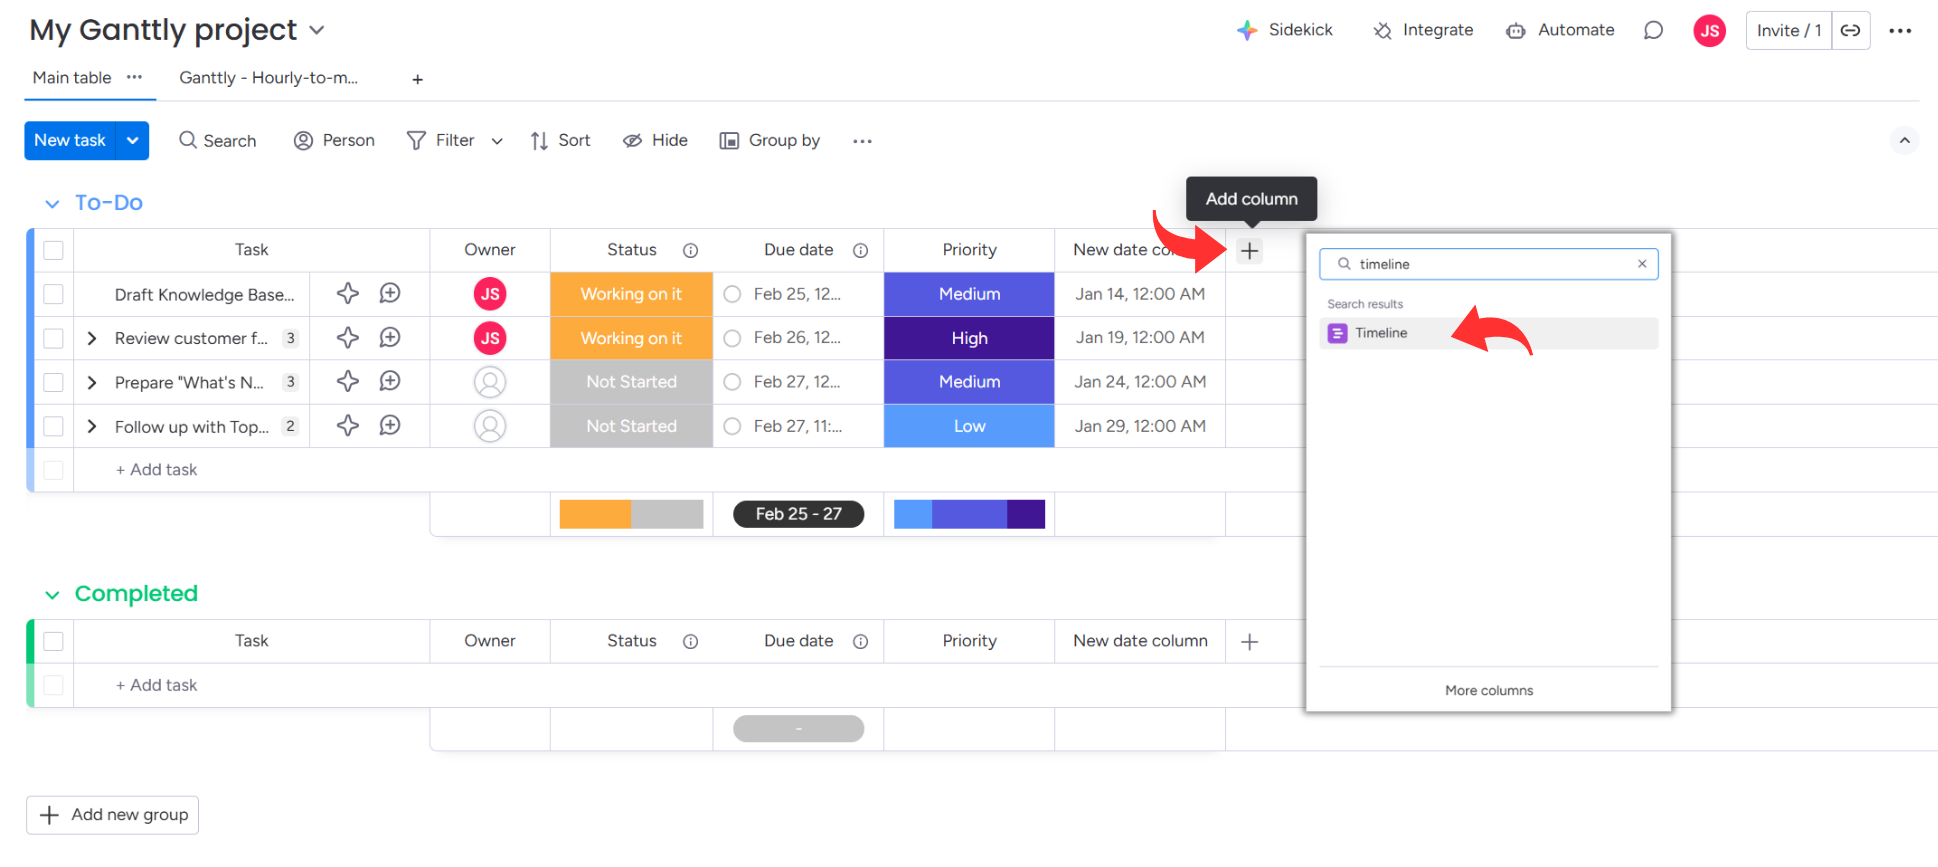
1. Adding columns from the board view
-
Timeline column: Add a single Timeline column to represent the duration of a task in one field.
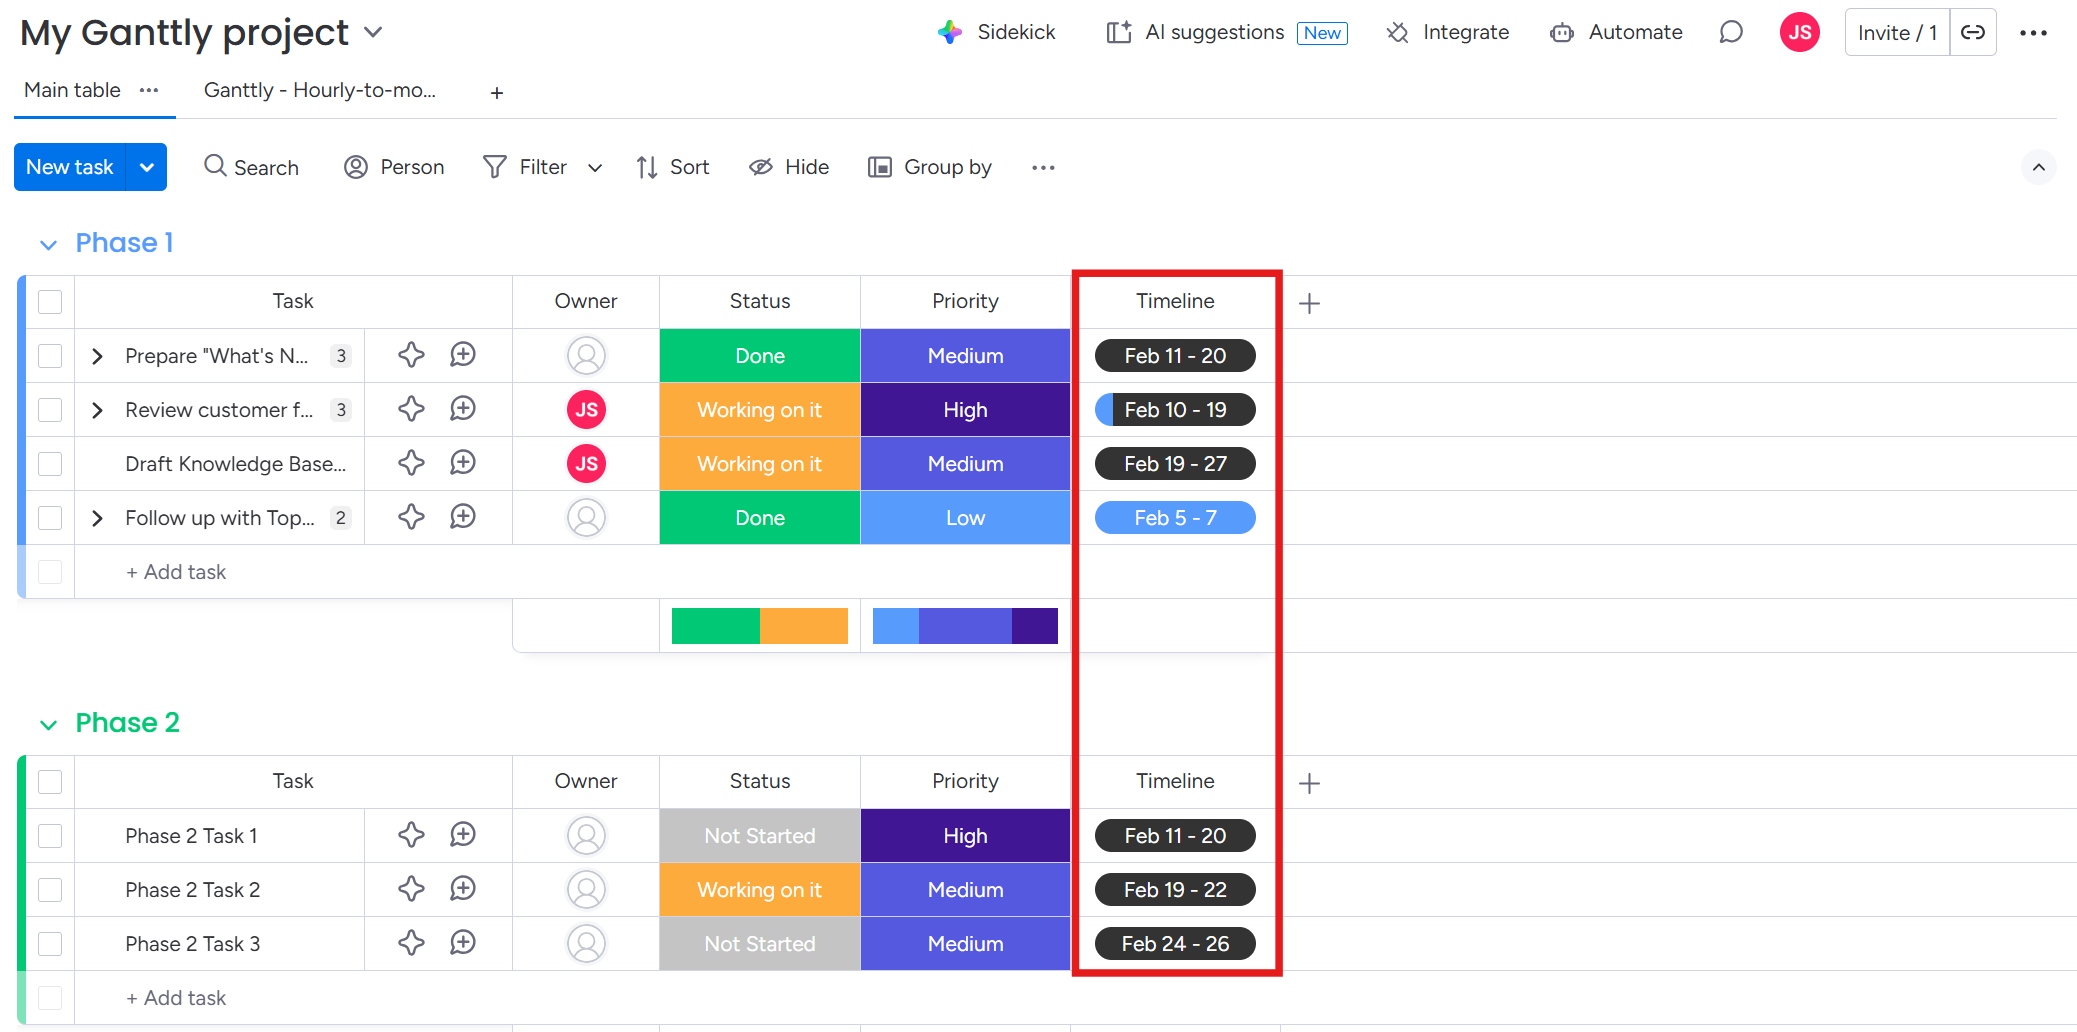
-
Two date columns: Add two separate Date columns - one for the Start Date and one for the End Date. Please note that using two separate Date columns allows you to set and display specific hours for your tasks on Ganttly.
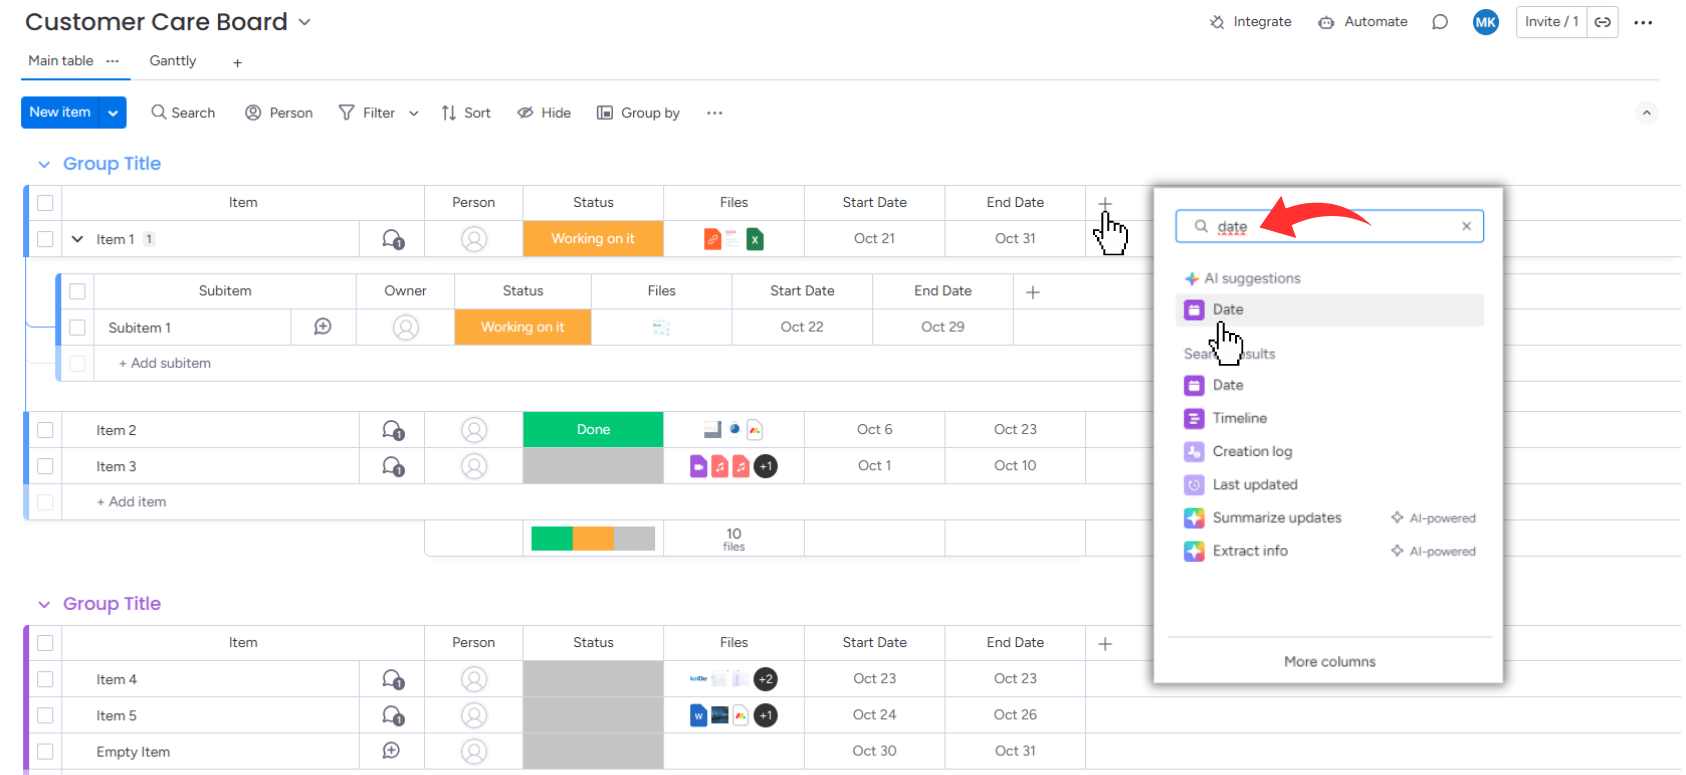
.png?cb=426d1d73f4fff6af3487060019c0b146)
-
Subitems: To include subitems in your Gantt chart, ensure you add corresponding date or timeline columns to the subitems as well.
Displaying hours
Ganttly allows you to show hours for more granular scheduling. Please note that displaying hours is only supported in Date columns; it is not available for Timeline columns due to the native characteristics of monday.com column types.
.png?cb=dddd57c18142e8538c57e12f2a67eef2)
Select Show time by default to enable choosing hours in your Date column.
.png?cb=d453e0a8c83b2b9b3115958981472c38)
You can also click the clock icon above the date field each time you set the dates.
2. Adding columns from the app view
Start by selecting the option Create new start/end date column.
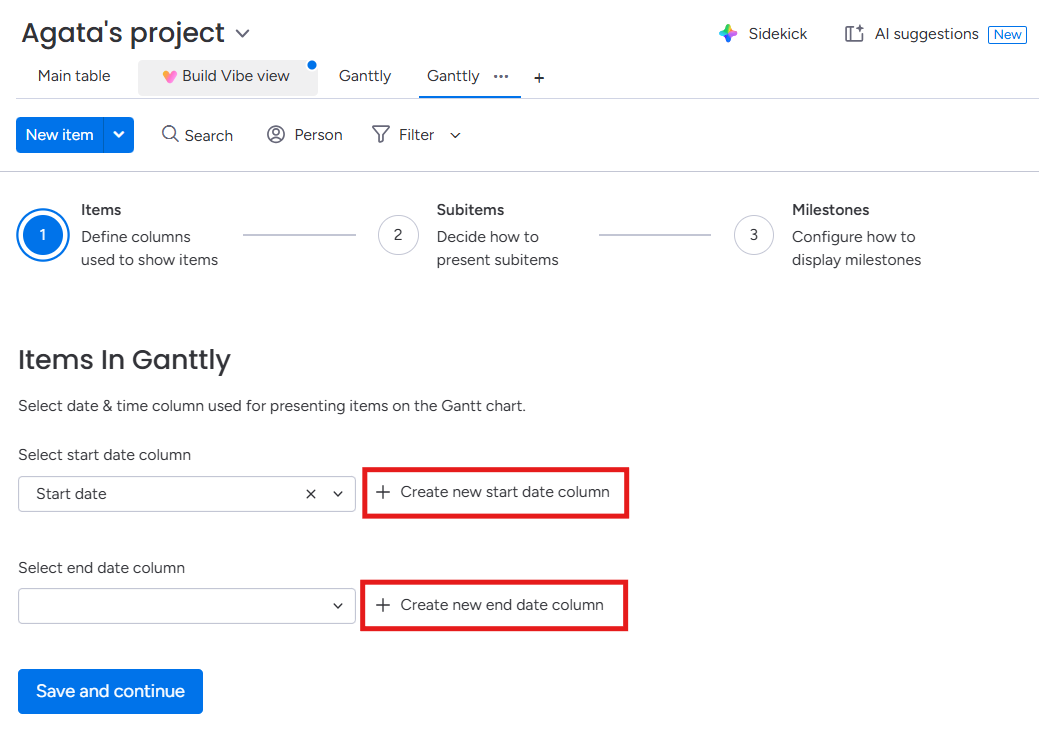
Name your new column and confirm by clicking Create new column.
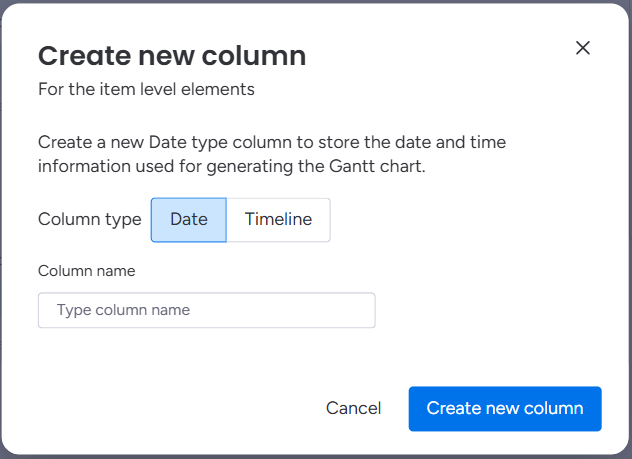
After creating and naming your new columns/column, go to your board view to fill in dates following these instructions.
Column mapping
Once your Data columns are set up, go back to the Ganttly column mapping screen and choose which columns from your board will be used to build the Gantt chart.
You can configure up to three sets of date data for your board:
-
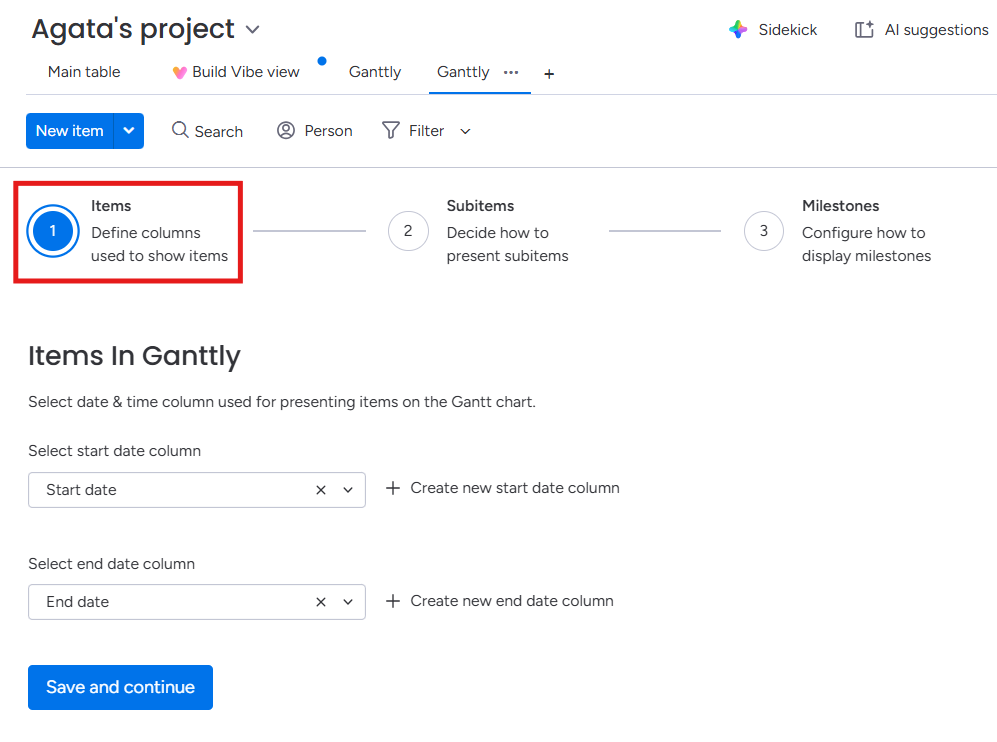
A Timeline column or a Start/End Date pair for items,
-
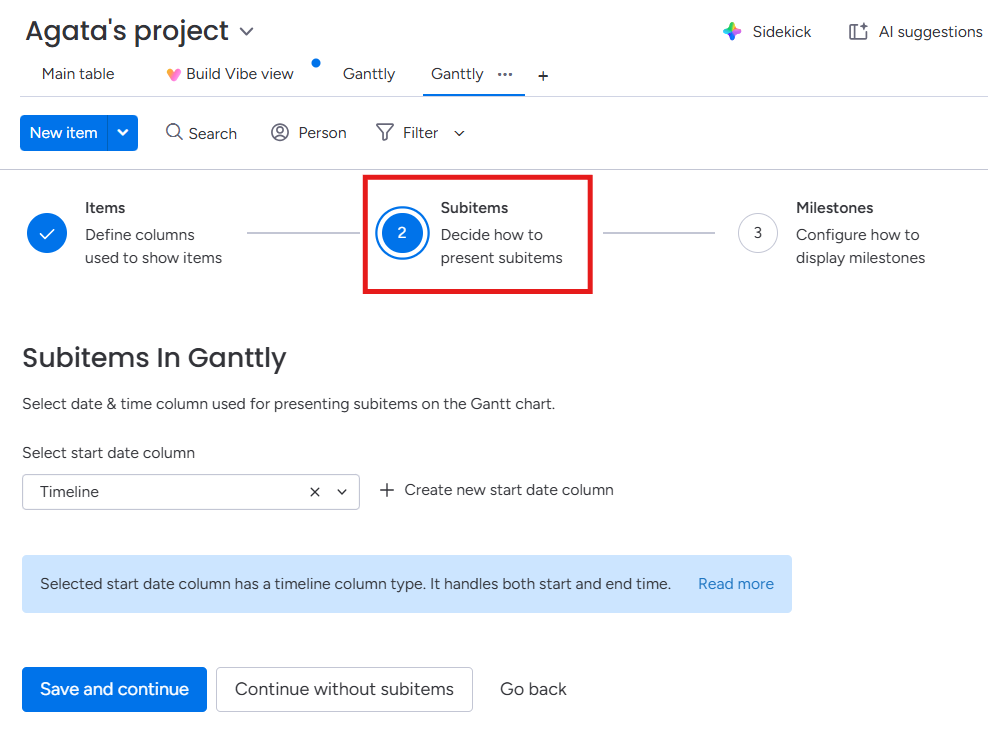
A Timeline column or a Start/End Date pair for subitems,
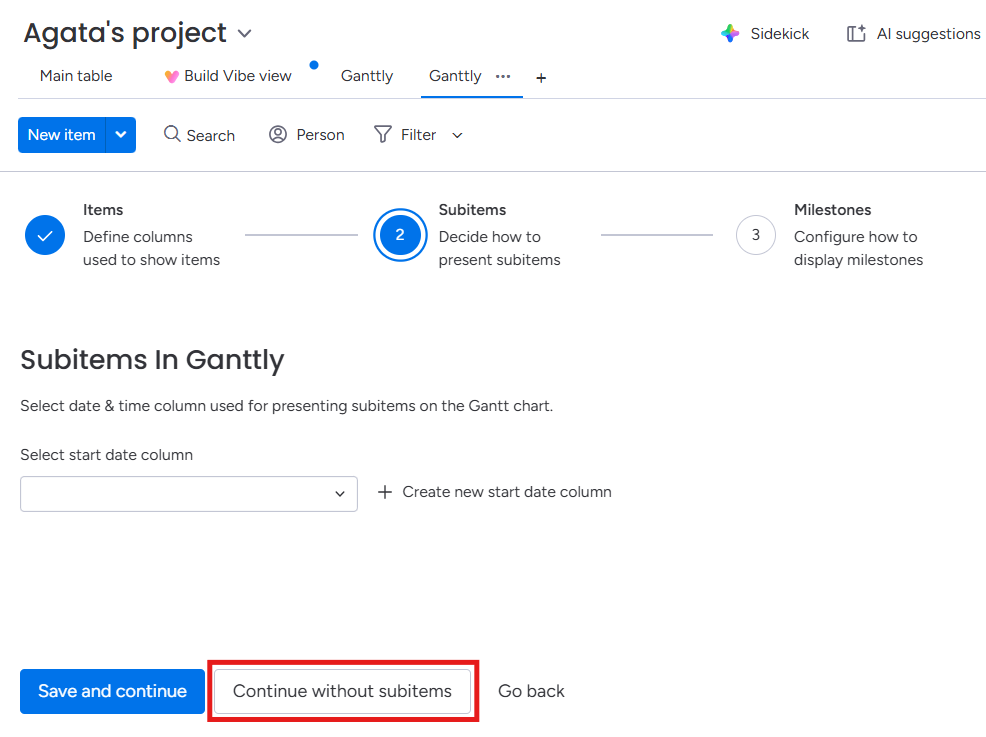
If you don’t want to include subitems, click Continue without subitems.
-
A Checkbox column for milestones.
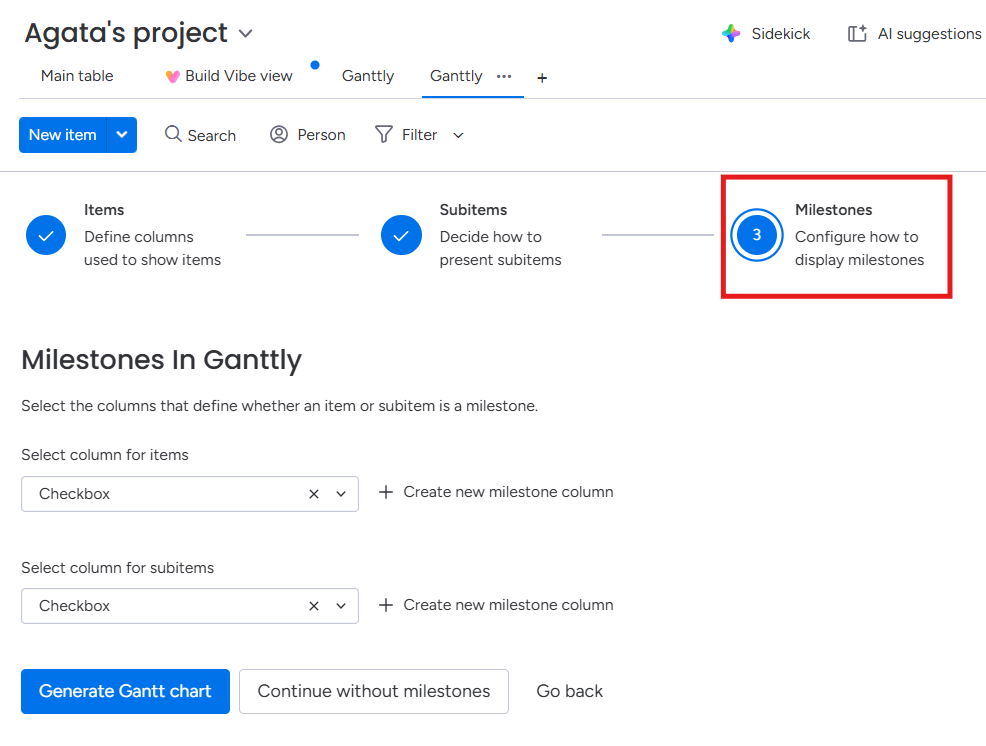
If you don’t want to include milestones, click Continue without milestones.
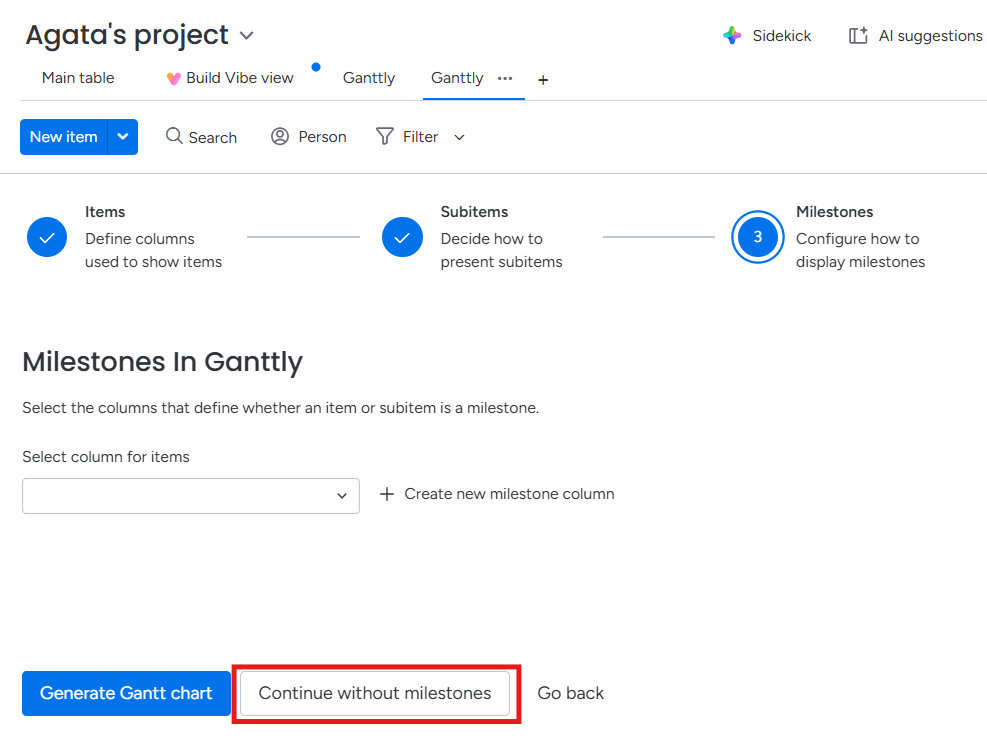
You must set up at least one complete date reference (either a Timeline column or a Start/End Date pair) for your items.
Milestones
You can set up Milestones - markers representing significant turning points or deadlines in your project timeline - by adding a Milestone Column to your board. Our Ganttly Chart allows you to track key project Milestones to give you a clear project overview.
To display milestones, your board must include a Checkbox column. You can set this up in two ways:
1. Adding columns from the board view
-
Add a Checkbox column to your board.
.png?cb=02a54511d4ebcce6c9e75796a20a1b0a)
-
Mark your items as Milestones in this column by checking the box for any item you wish to designate as a milestone.
2. Adding columns from the app view
-
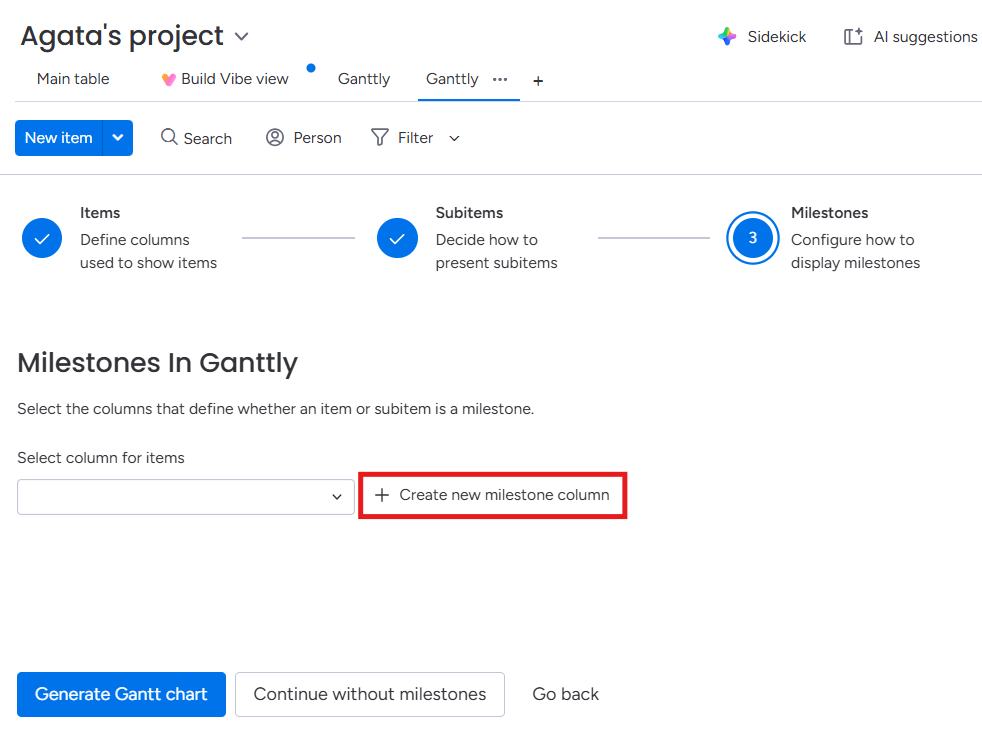
On milestone configuration window, select the option Create a new milestone column.
-
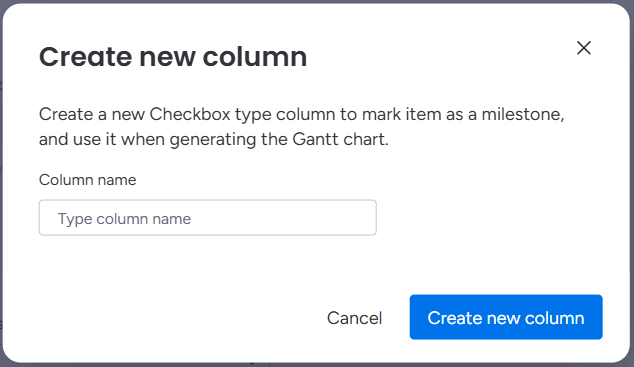
Name your new column and confirm by clicking Create new column.
-
After creating and naming your new column, go to your board view to check the boxes for the items you want to mark as milestones.
The Ganttly chart will update automatically to display your milestones as diamond shapes.
Dependencies
Only Pro & Enterprise monday.com users can set up dependencies between items on
their board.
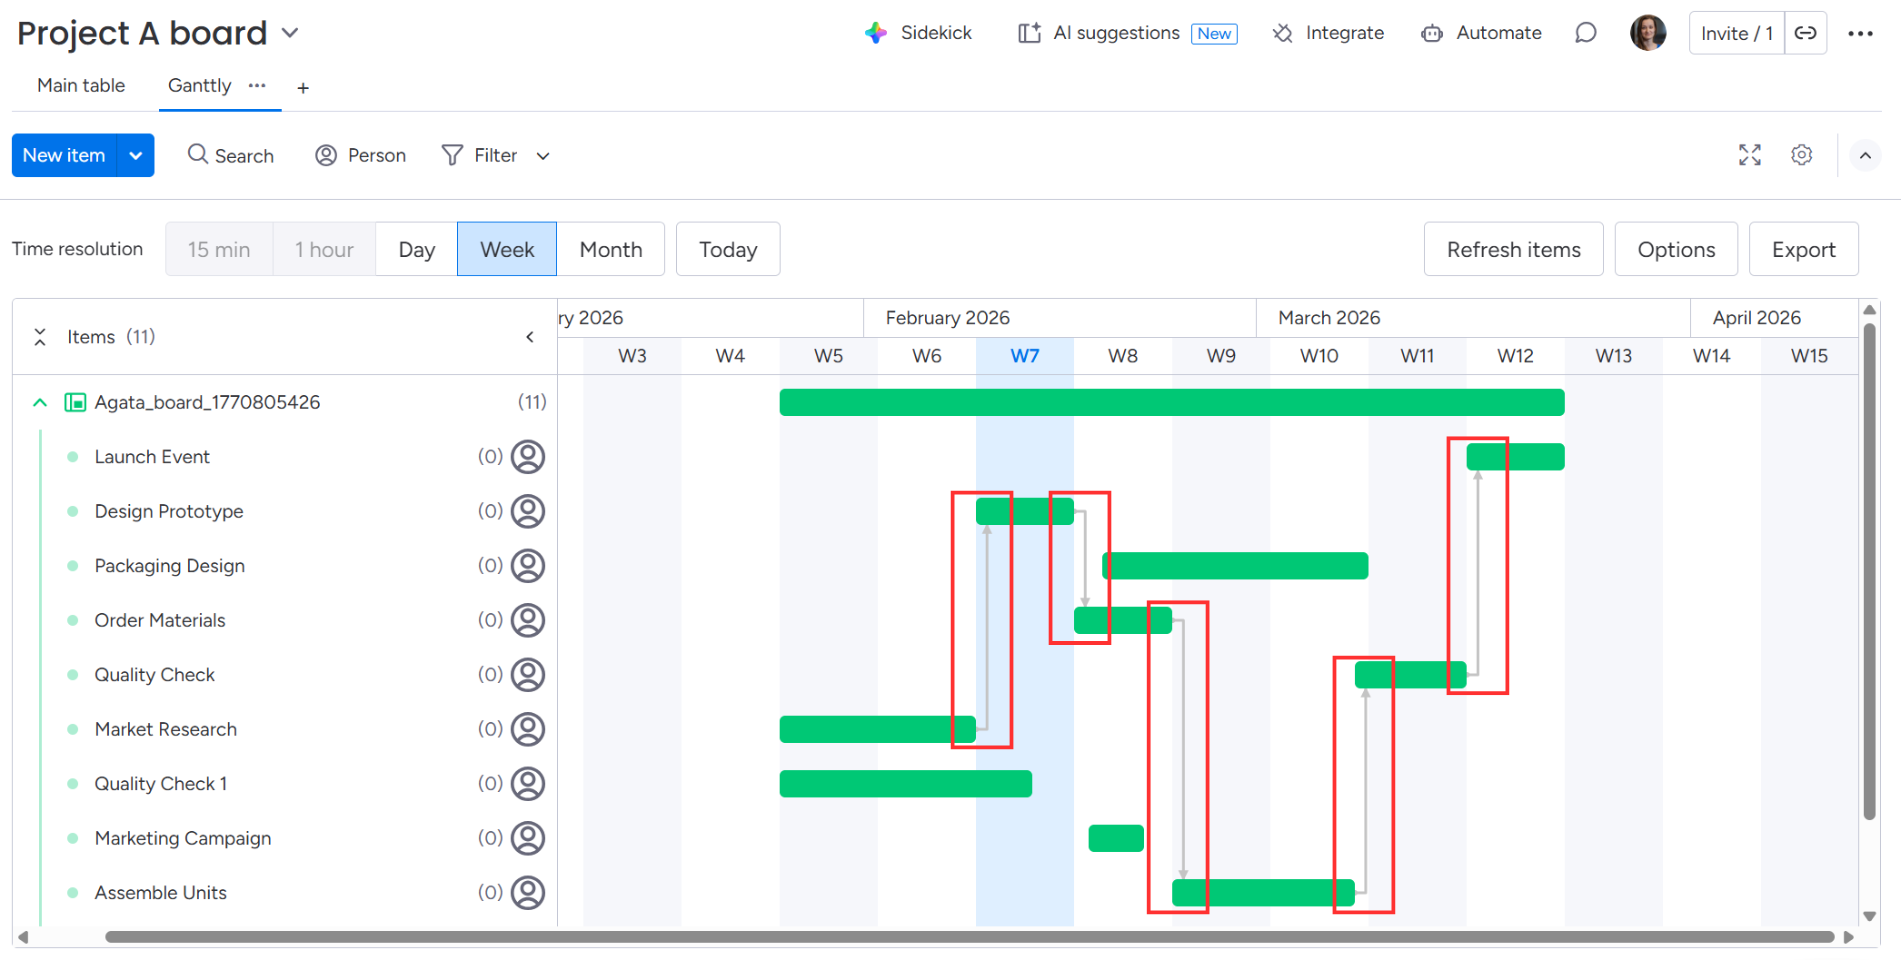
You can set up Dependencies - links between items showing how they relate to one another - by adding a Dependency Column to your board. Our Ganttly chart can visualize these connections to give you a clear project overview.
Please note that Ganttly currently displays the existence of a dependency, but not its specific direction, like start to start, finish to finish, etc. Support for dependency direction is on our roadmap.
To visualize your dependencies in the Ganttly chart:
-
Add a Dependency Column to your monday.com board.
.png?cb=d766da750574e7e64c434c54cdd6d5f0)
-
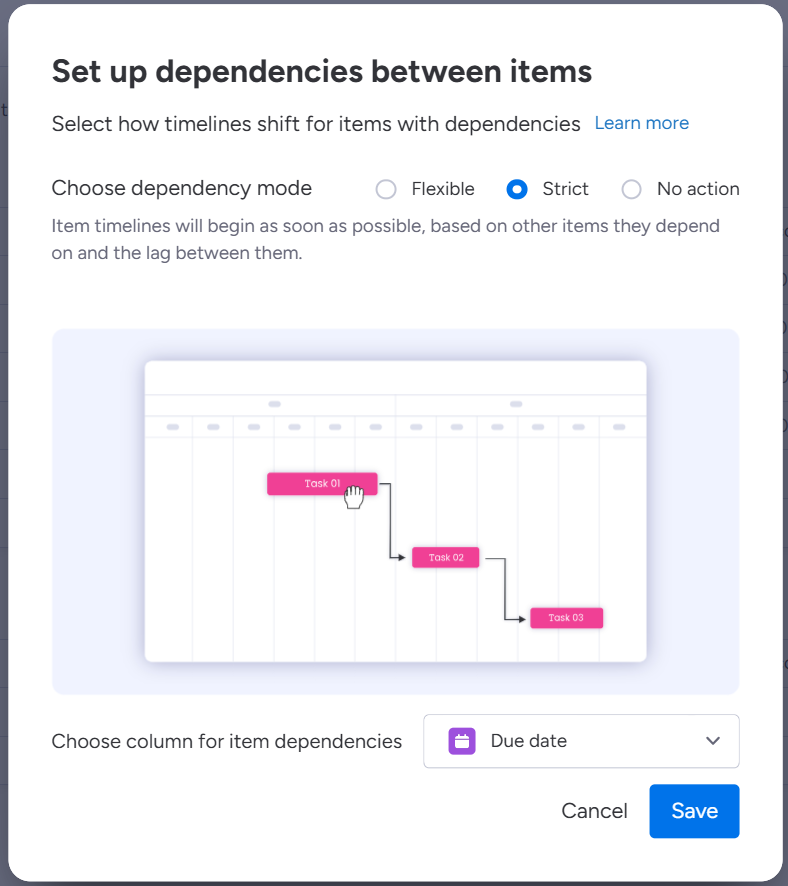
Define your dependency logic in the pop-up window and click Save.
-
In the new Dependency column for a task (the dependent), click on the cell. Select the item (the dependee) that it depends on from the list.
.png?cb=081a8438eee02d792ad89ef63a585fe7)
-
The Ganttly chart will update automatically to display these connections.
Critical path
The Critical Path feature helps you identify the sequence of tasks that determines the overall duration of your project.
To visualize the critical path on your board, the following conditions must be met:
-
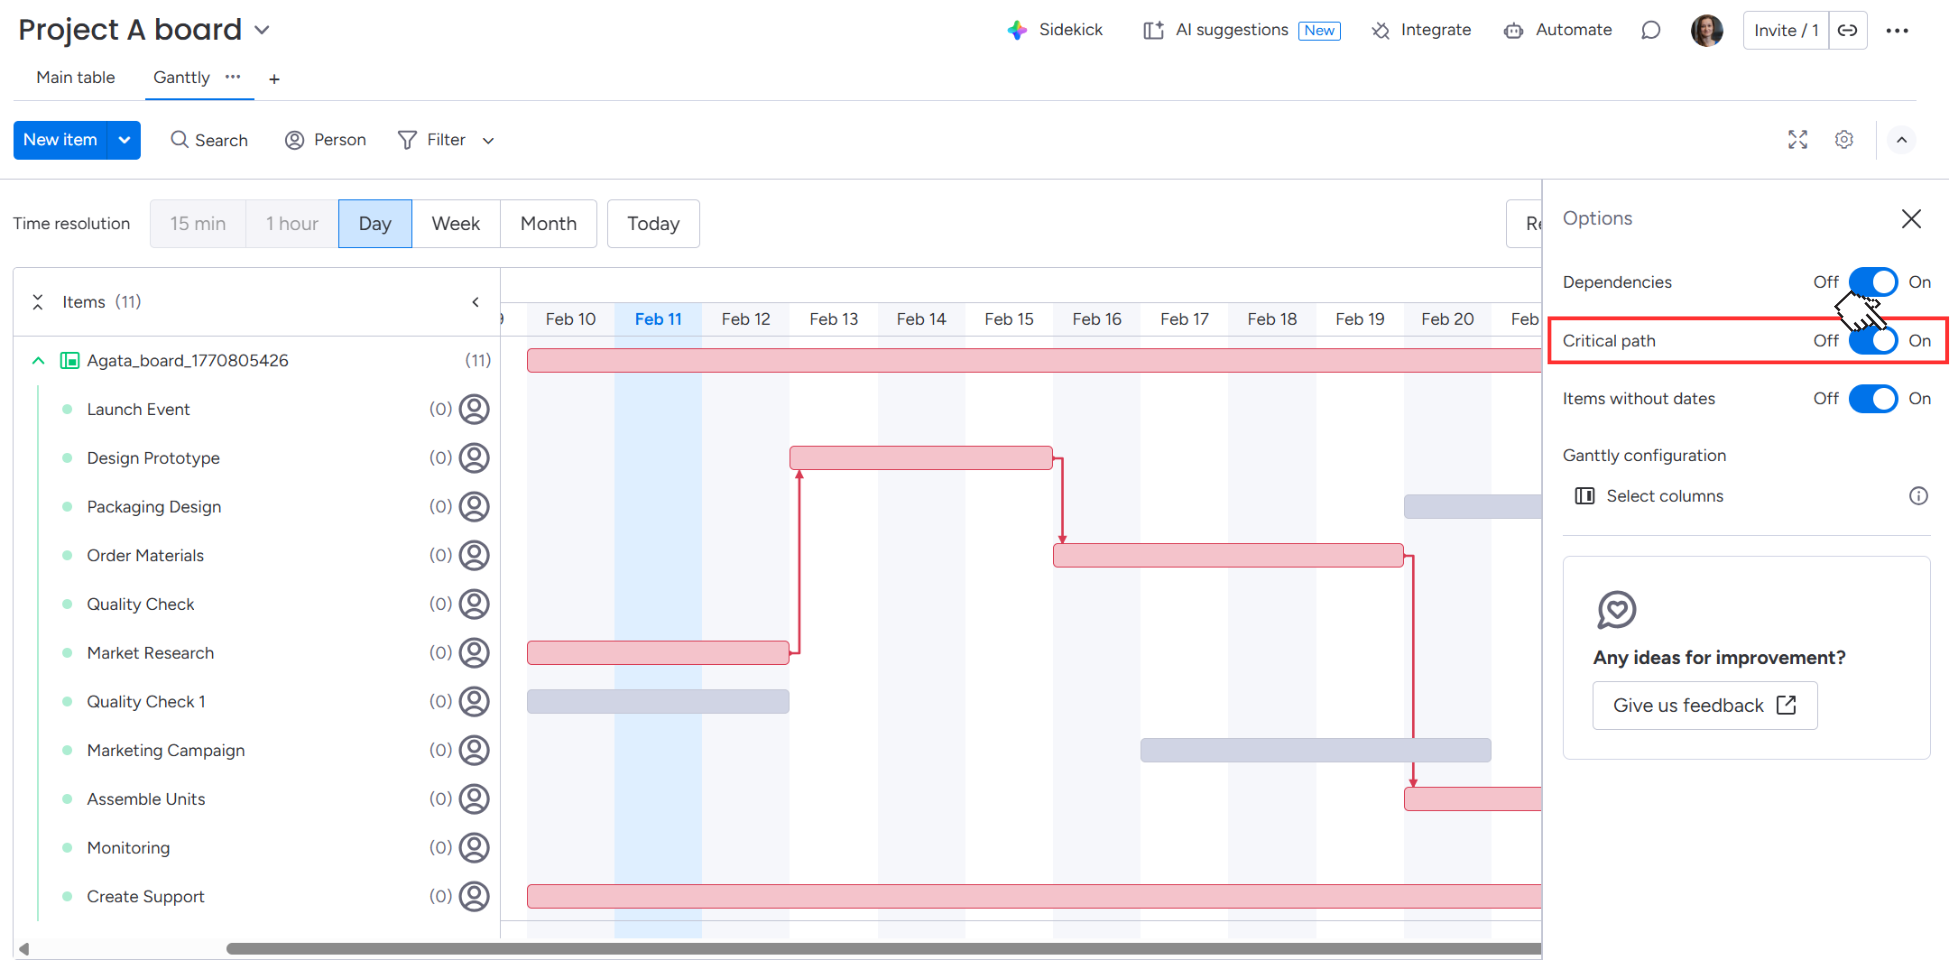
The Critical Path option must be toggled on in the Options drawer.
-
The path must start from the earliest date and end at the latest date among all items currently displayed on the Gantt chart.
-
The critical path is calculated only for items; it is not supported for subitems yet.
-
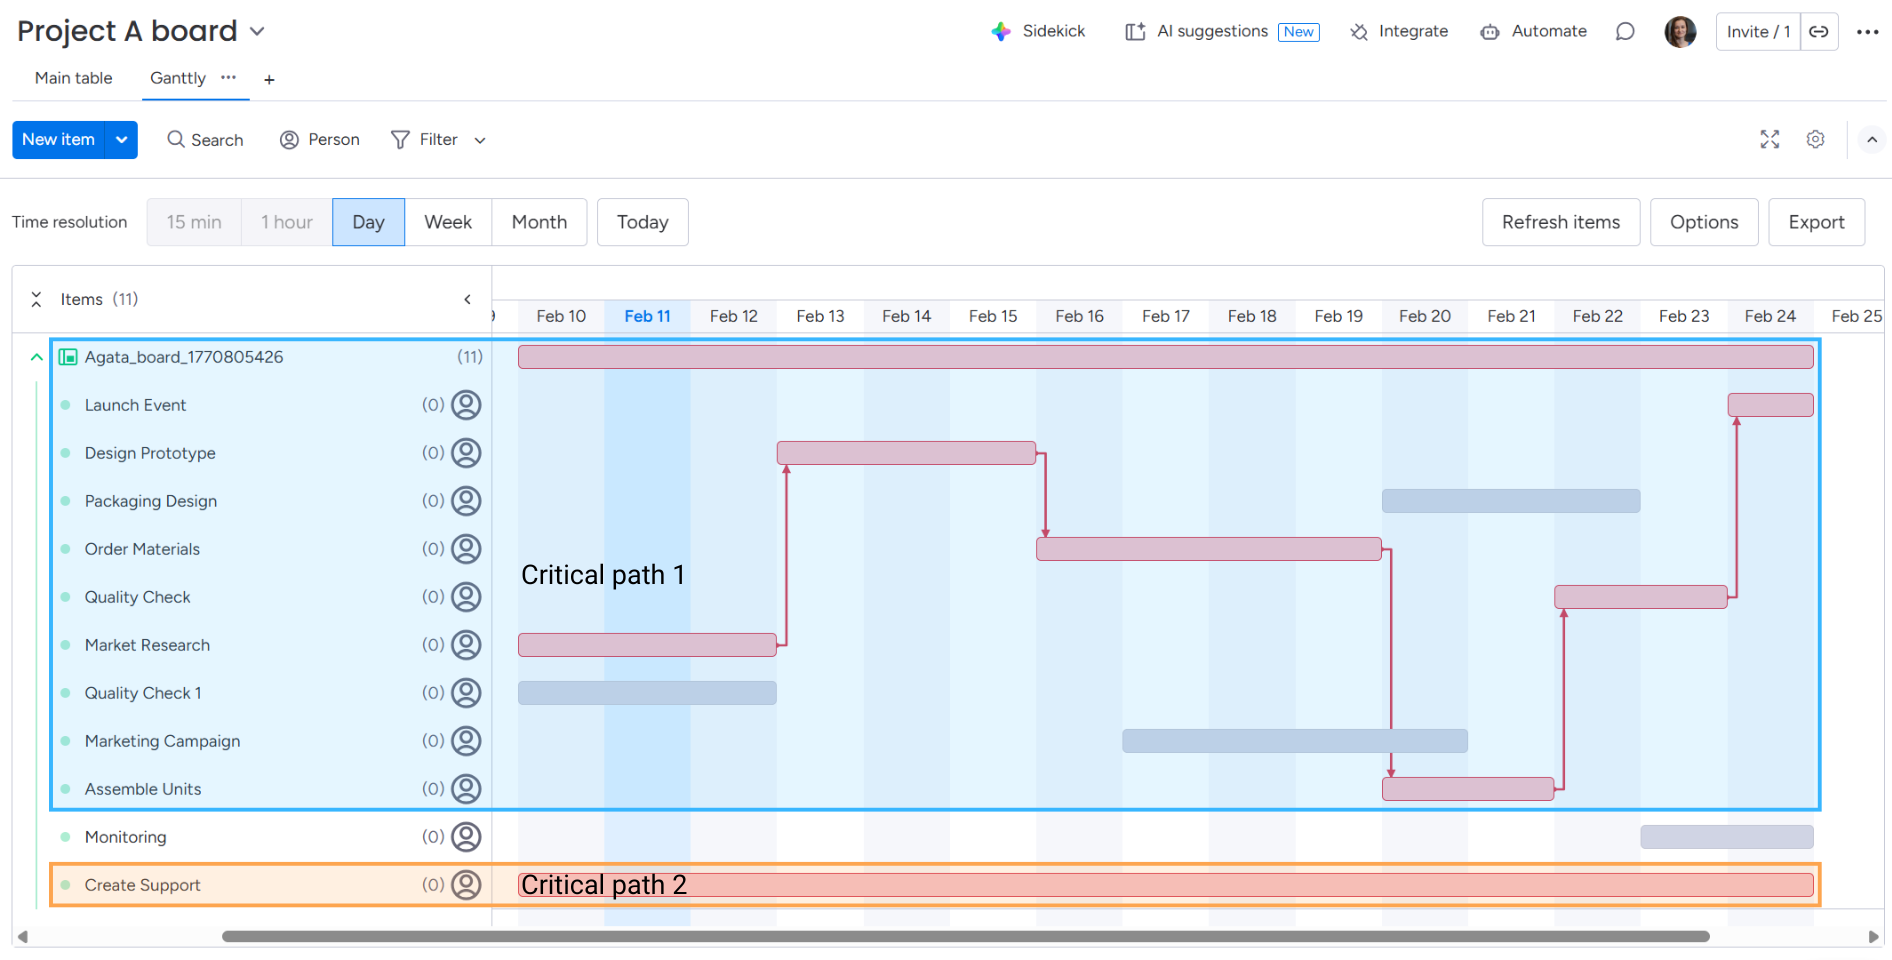
Your board can display multiple critical paths simultaneously if each path meets the necessary requirements.
A critical path can be formed in two ways:
-
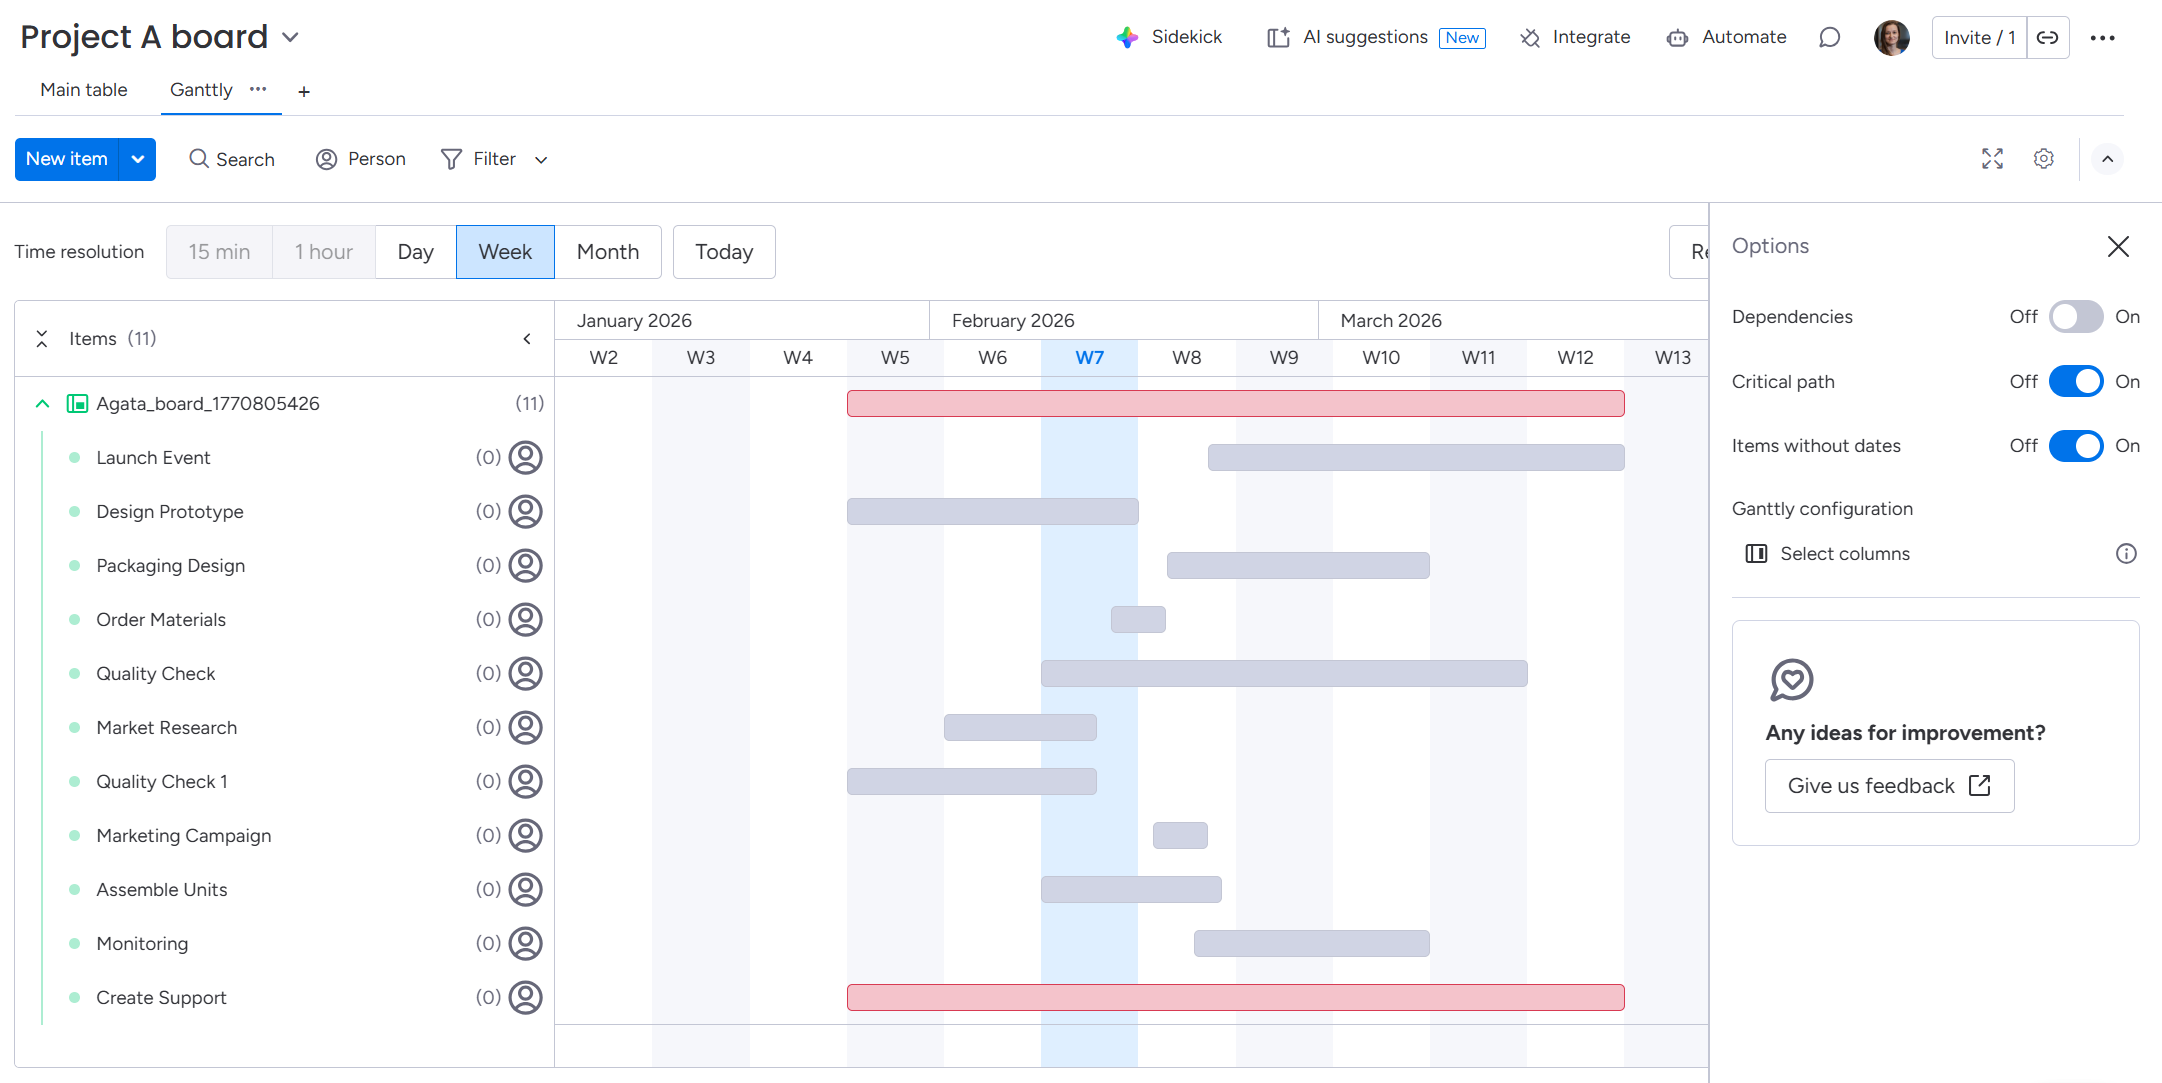
A path can consist of just one task. In this scenario, the Dependency Column does not need to exist on the board, and dependencies can be toggled off in the Options drawer.
-
A path can be a chain of tasks linked by dependencies. For this to work:
-
The Dependency Column must exist on the board.
-
The dependency option must be enabled in the Ganttly Options.
-
There must be no gaps between tasks in the chain (zero lag/zero gap tolerance).
-
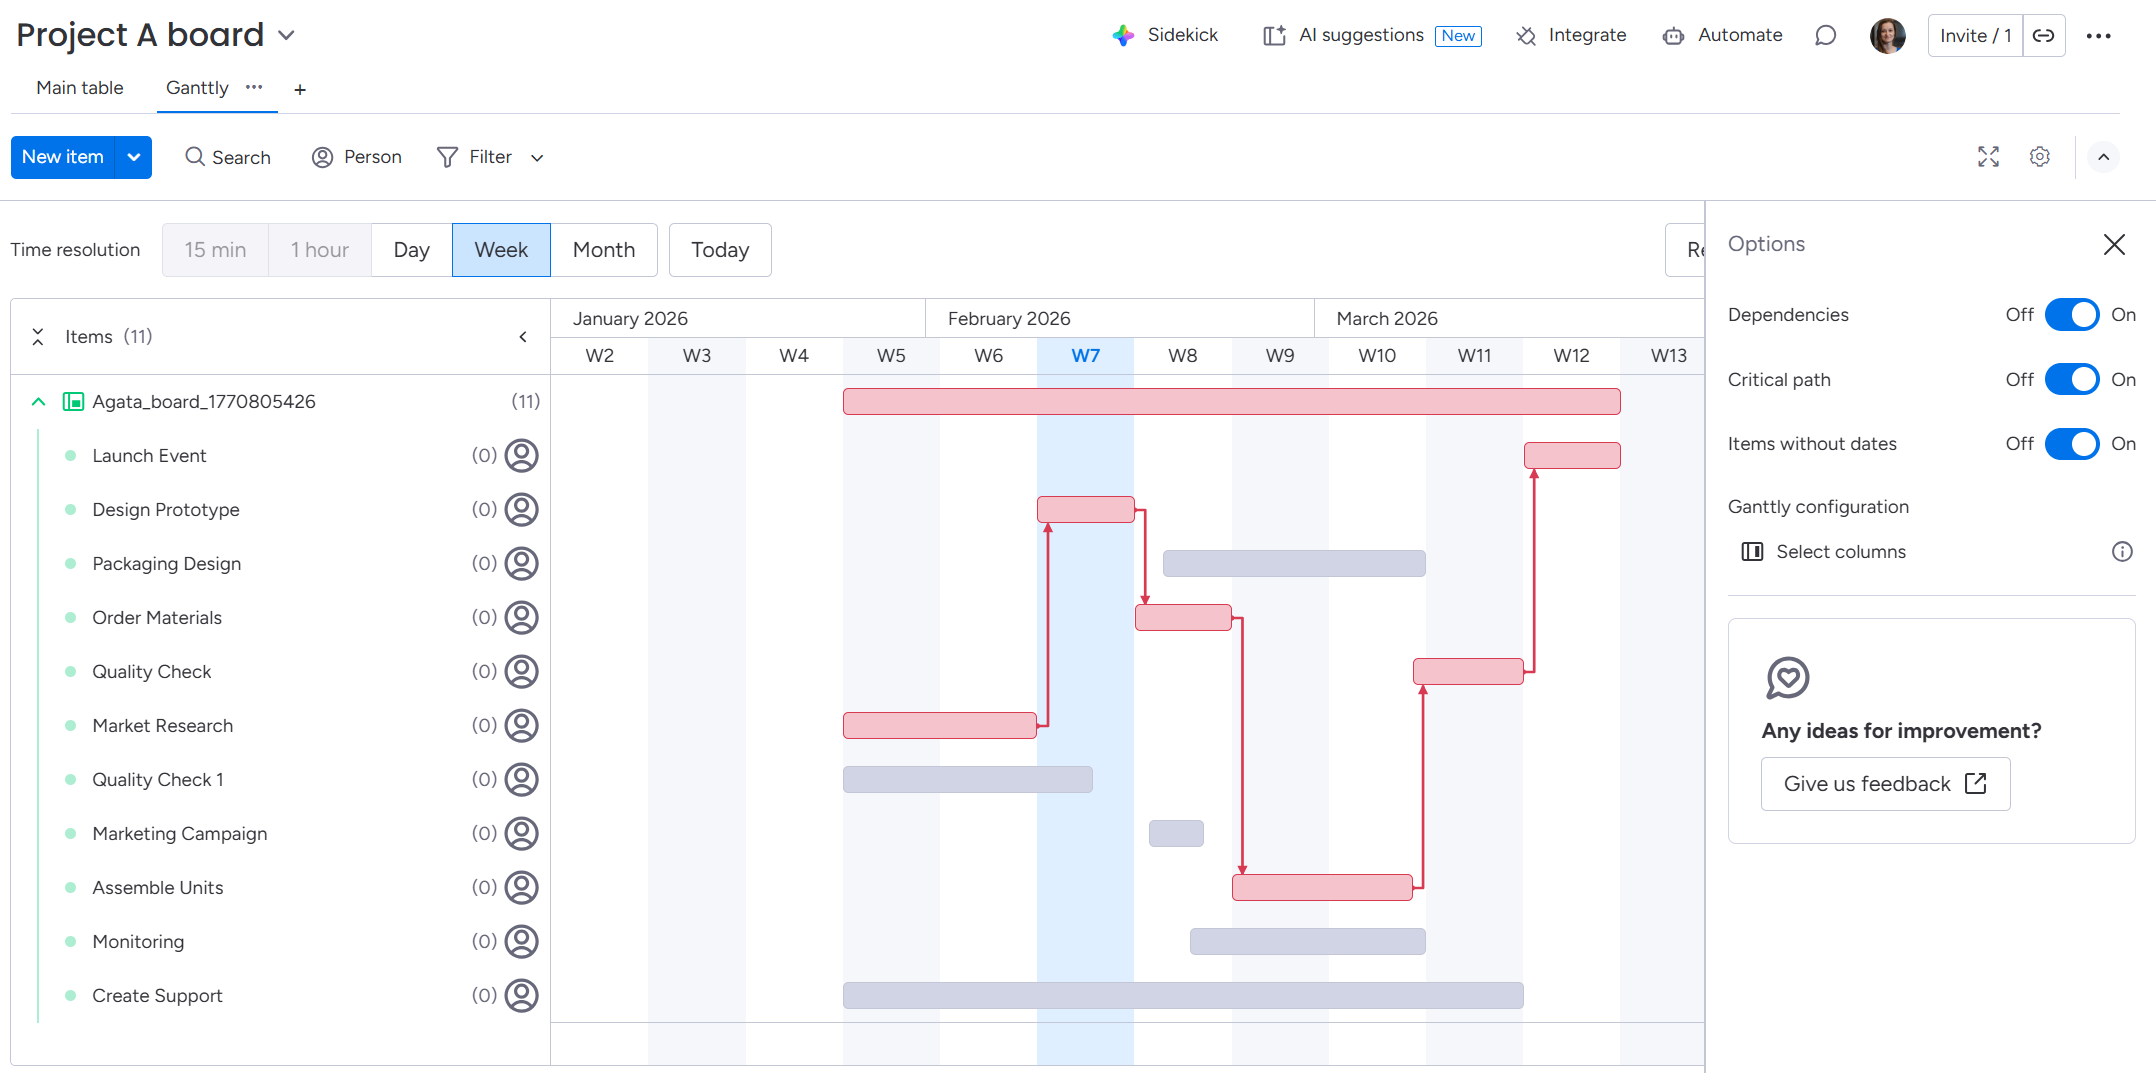
If an item is not on the critical path, its bar will appear gray while the toggle is active.
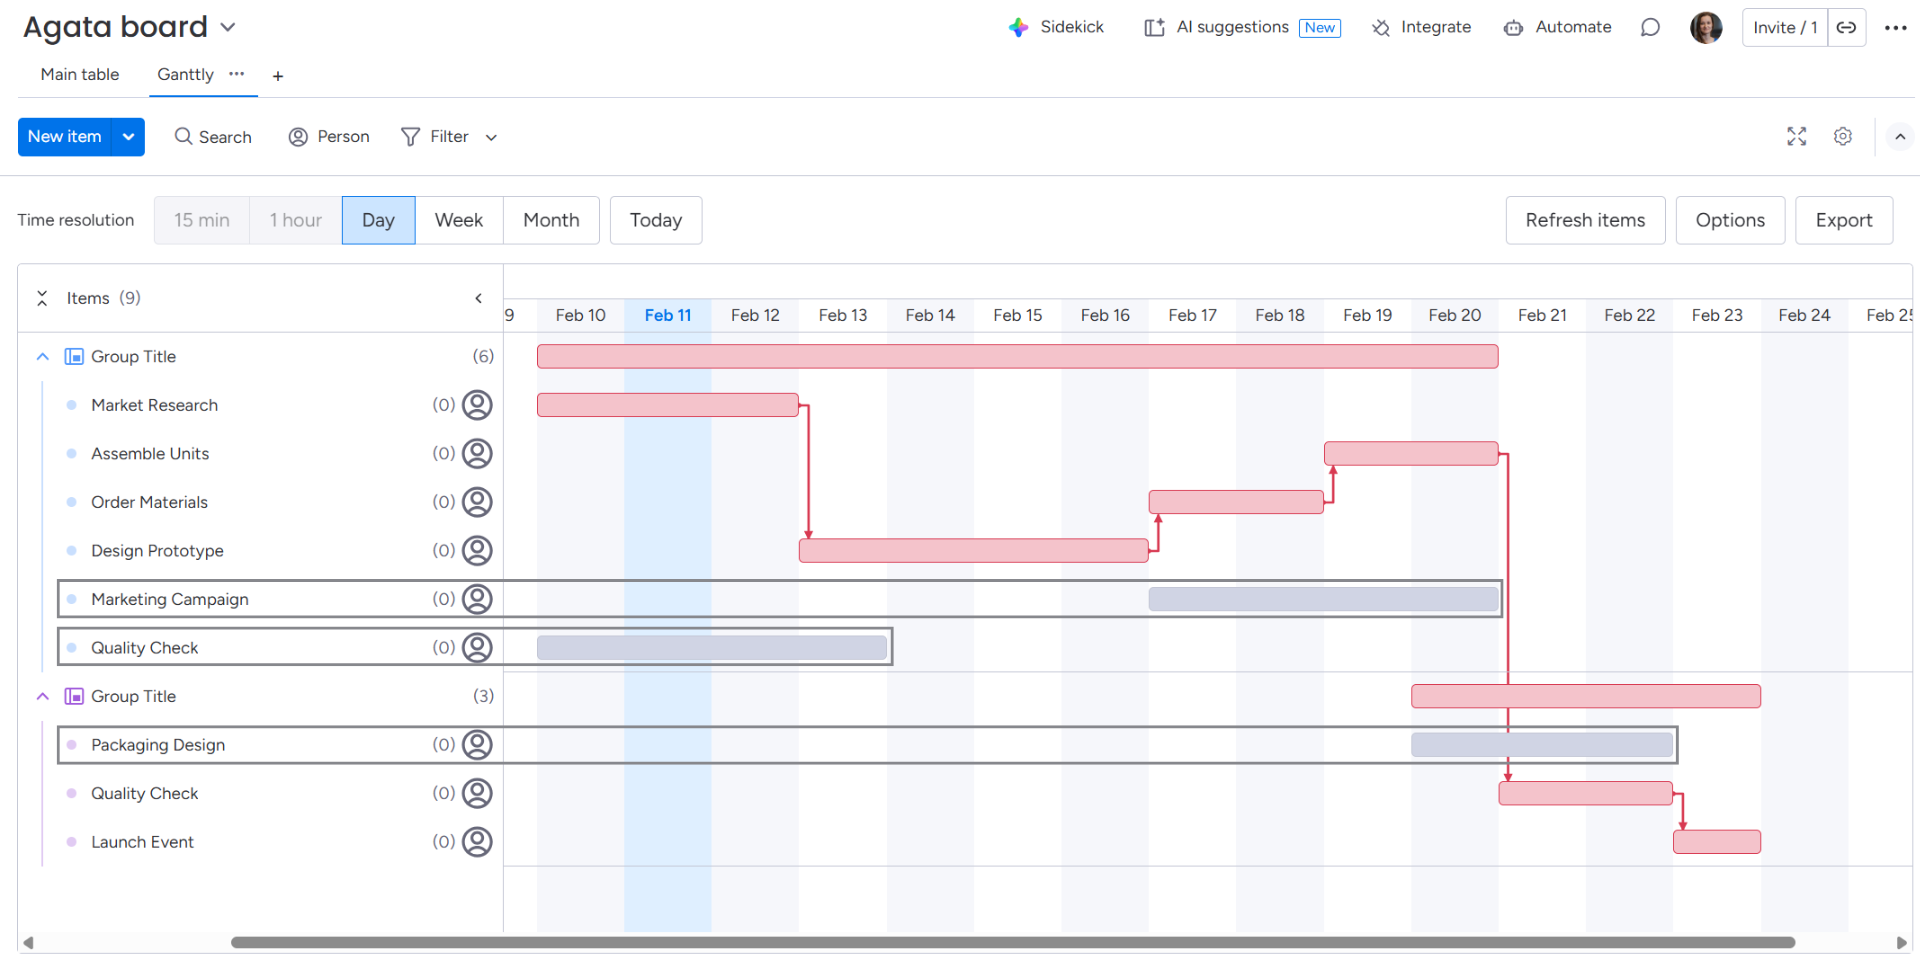
If the option is toggled on but your project does not currently have a logical critical path (e.g., due to missing dependencies), all item bars will turn gray.