.png)
For a quick walkthrough of this feature, watch the video below 📽️.
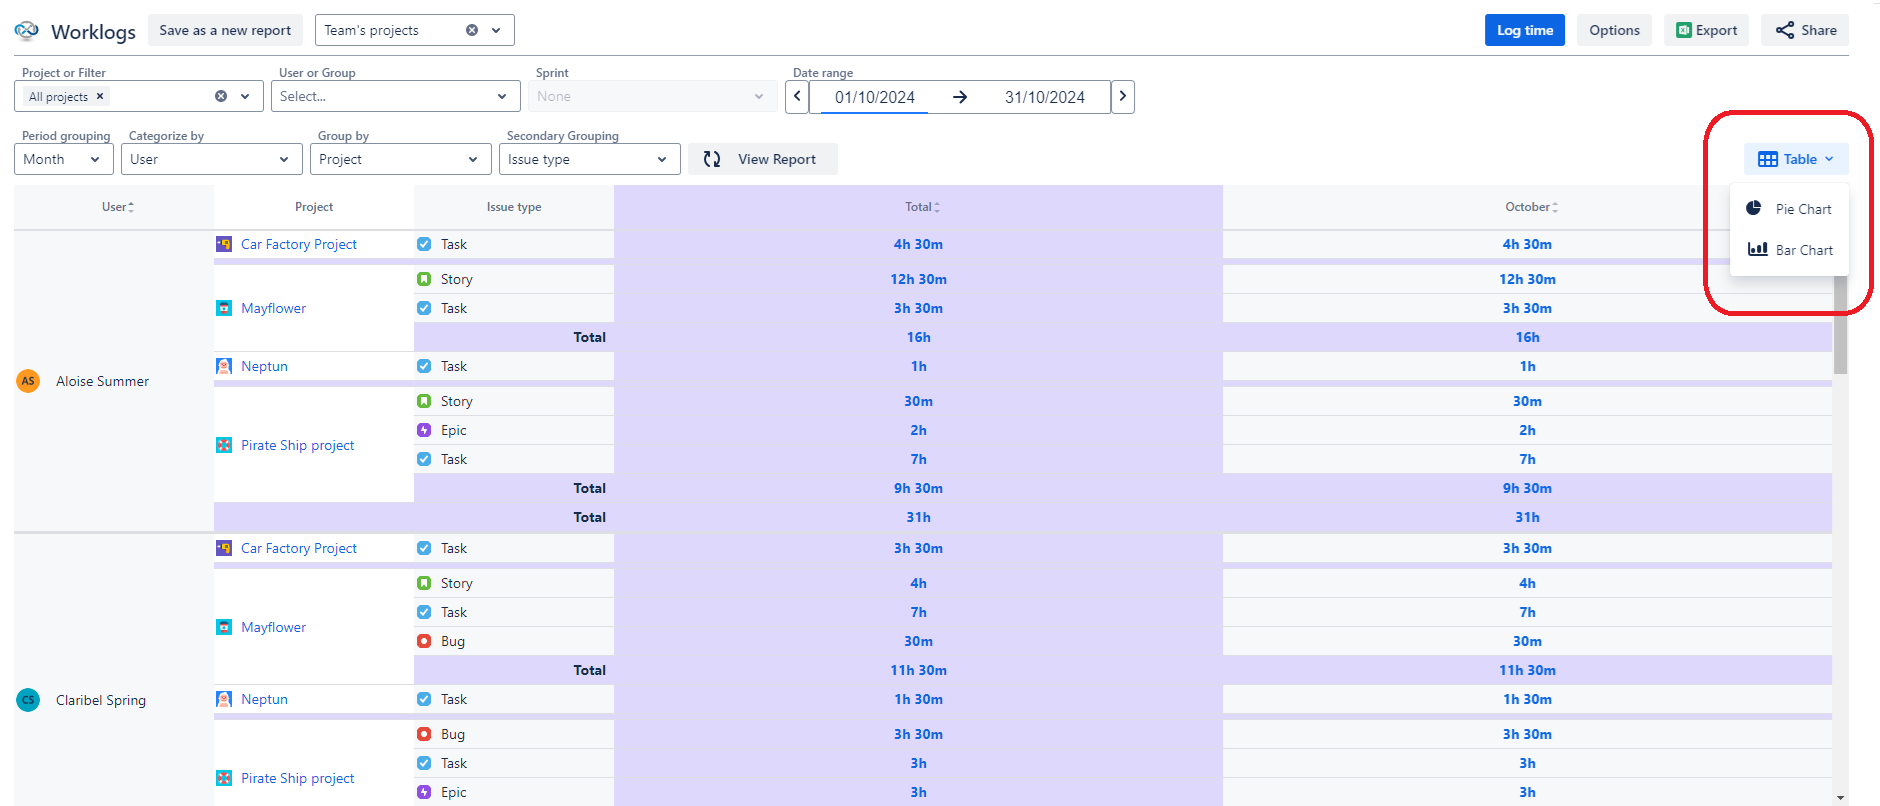
Charts are an alternative way to visualize your data. On the right side of your Worklogs page, you can change your table to a Pie Chart or Bar Chart.
You can also download the generated charts as PNG files.