.png)
For a quick walkthrough of this feature, watch the video below 📽️.
Categorization and Grouping consist of ‘Categorize by’, ‘Group by’, and ‘Secondary Grouping’. Together they allow you to break down the data up to three levels. The data (in the left column) can be displayed for users that logged time, projects, or Jira issue fields.
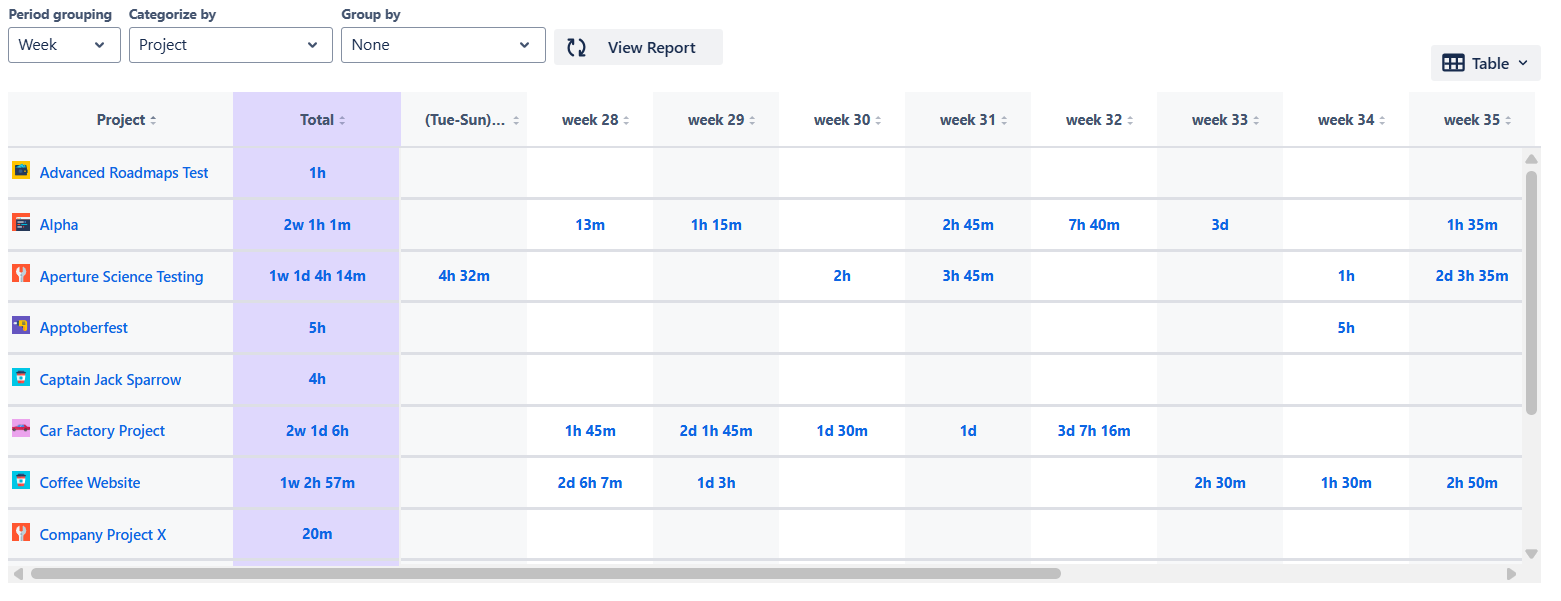
Imagine you’d like to learn how much time was spent on each of your projects. You can achieve this by setting ‘Categorize by’ to ‘Project’ as presented below.
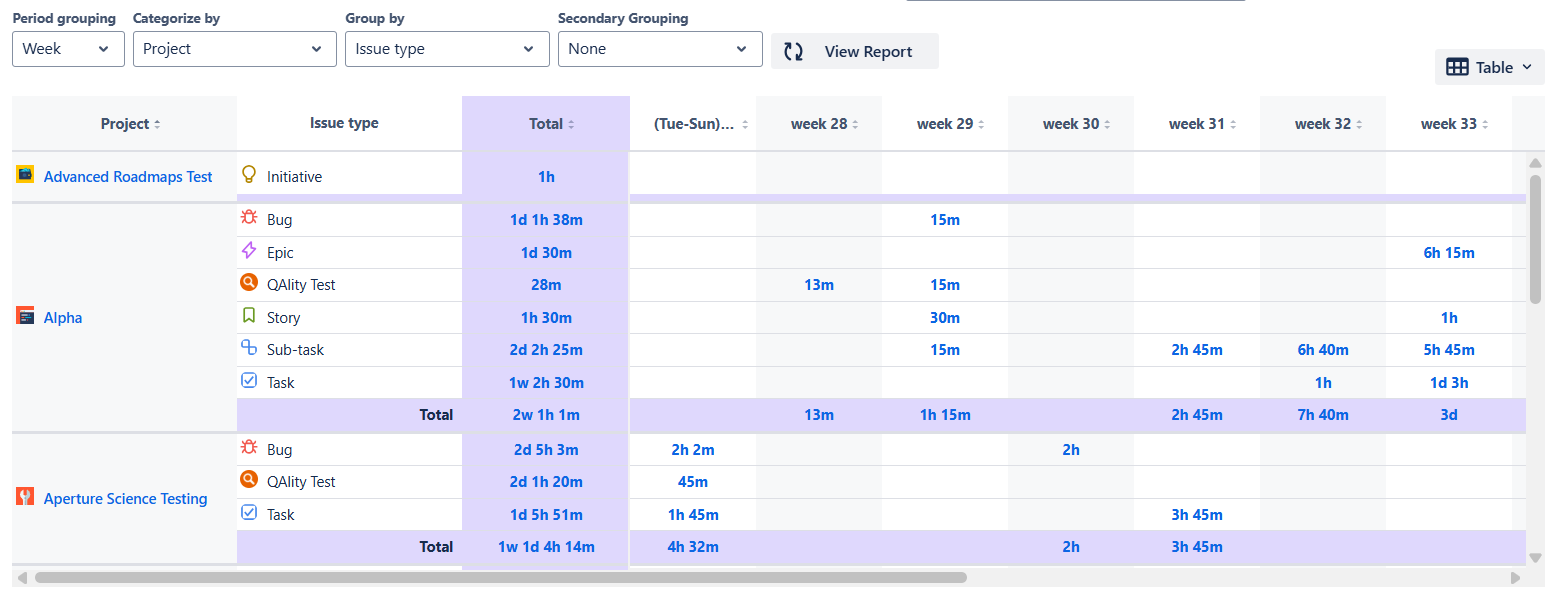
In addition to this, you might also want to learn how much time was spent on bug fixing, new stories, and epics. You could do that by additionally setting ‘Group by’ to ‘Issue type’ as shown. You can still see the total time spent per project, but you also get additional details on how it looks for each issue type in the project.
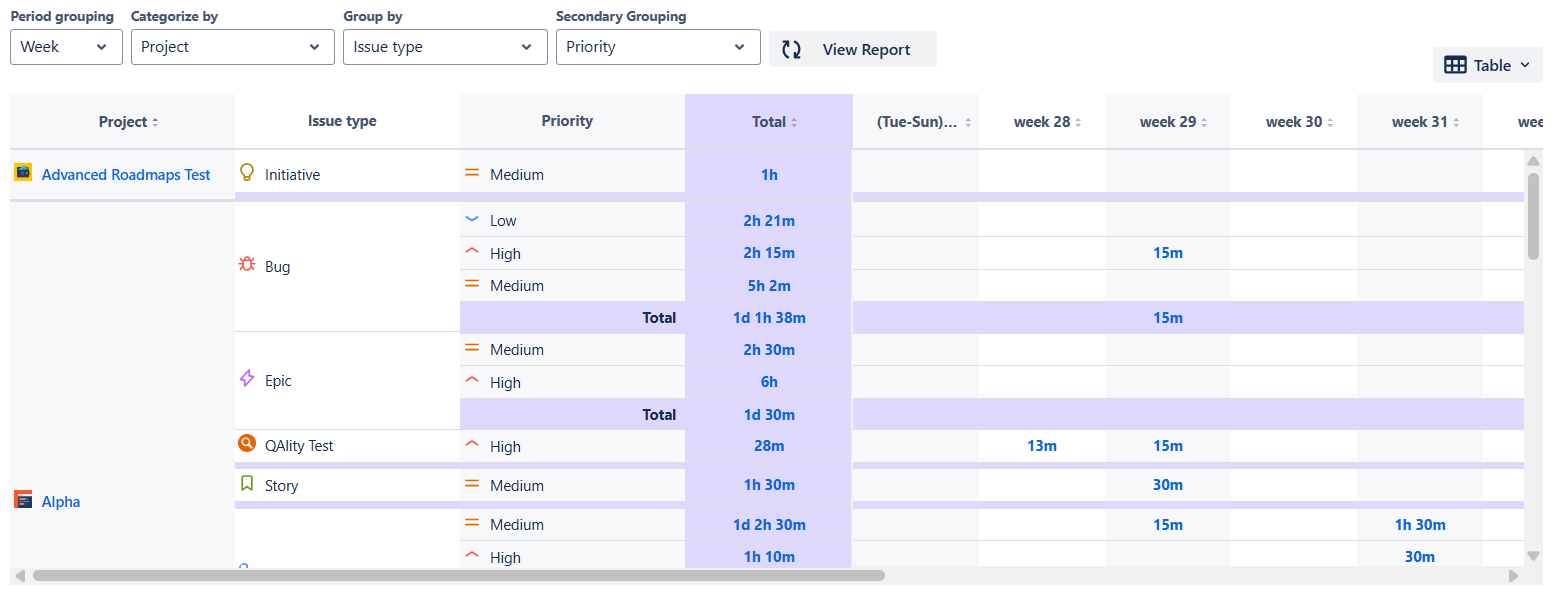
In the same manner, you can break down the details presented by the Worklogs table to the third level. In our example, by setting ‘Secondary grouping’ to ‘Priority’, we also learn for each project, and each issue type within those projects, how much time was spent on issues classified as high, medium, and low priority. ‘Secondary grouping’ is an optional field. You can leave it empty if you feel like it’s not necessary to use it.