
For a quick walkthrough of this feature, watch the video below 📽️.
Charts provide an alternative way to visualize your Worklogs data. On the right side of the Worklogs page, you can switch the table view to a Pie chart or Bar chart, and then download the chart as a PNG file.
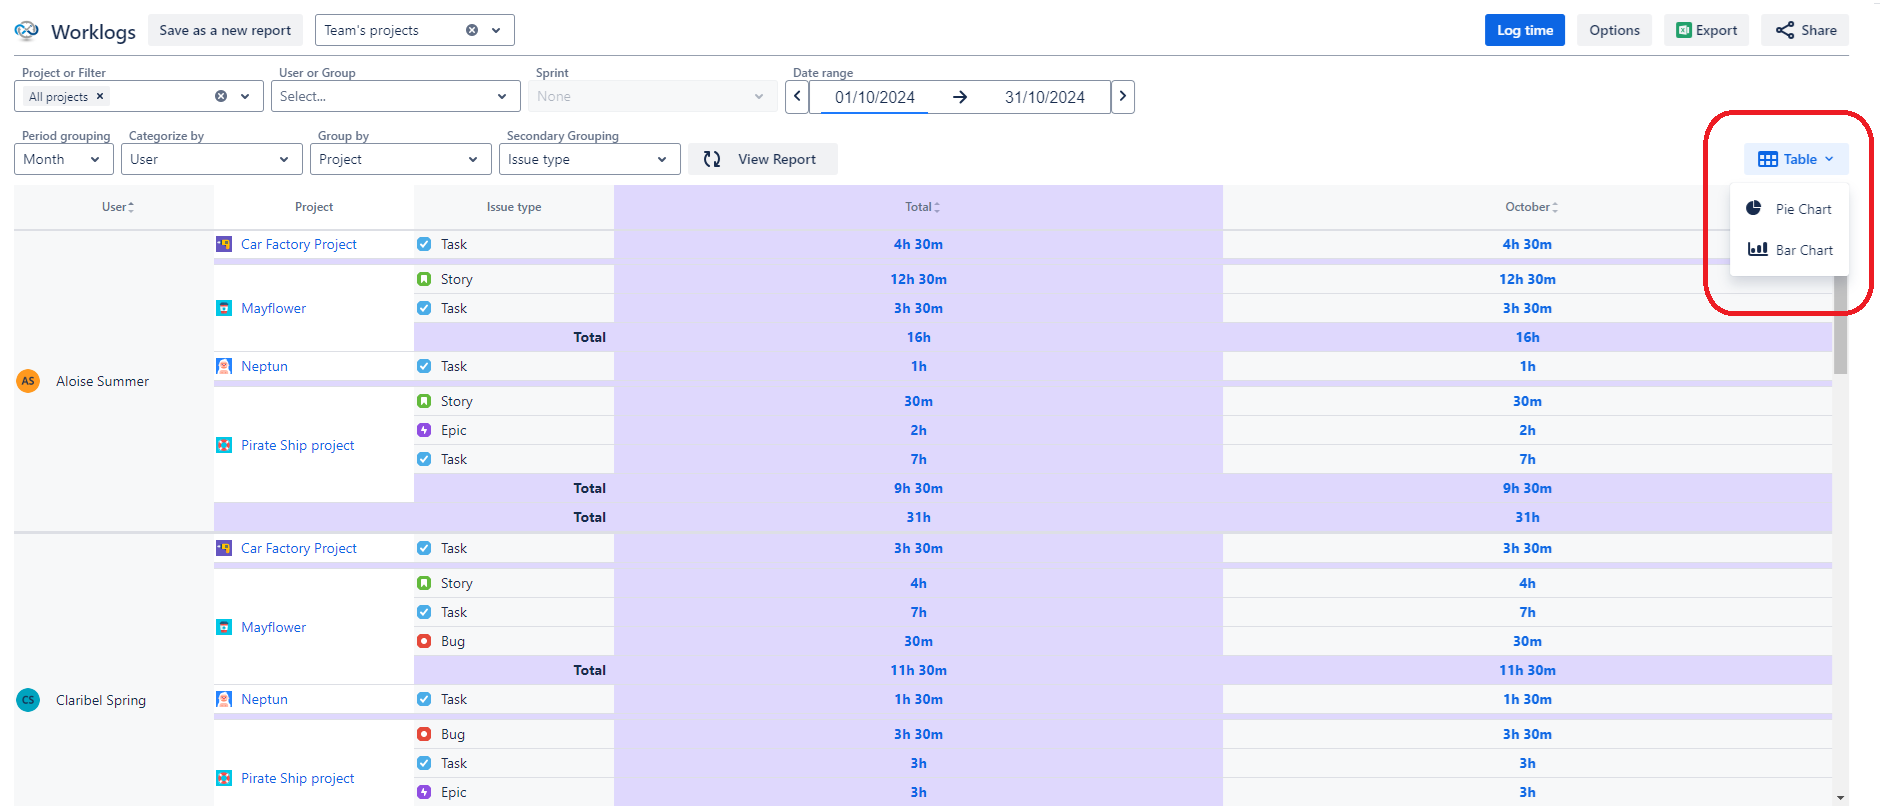
You can also download the generated charts as PNG files.
Pie chart
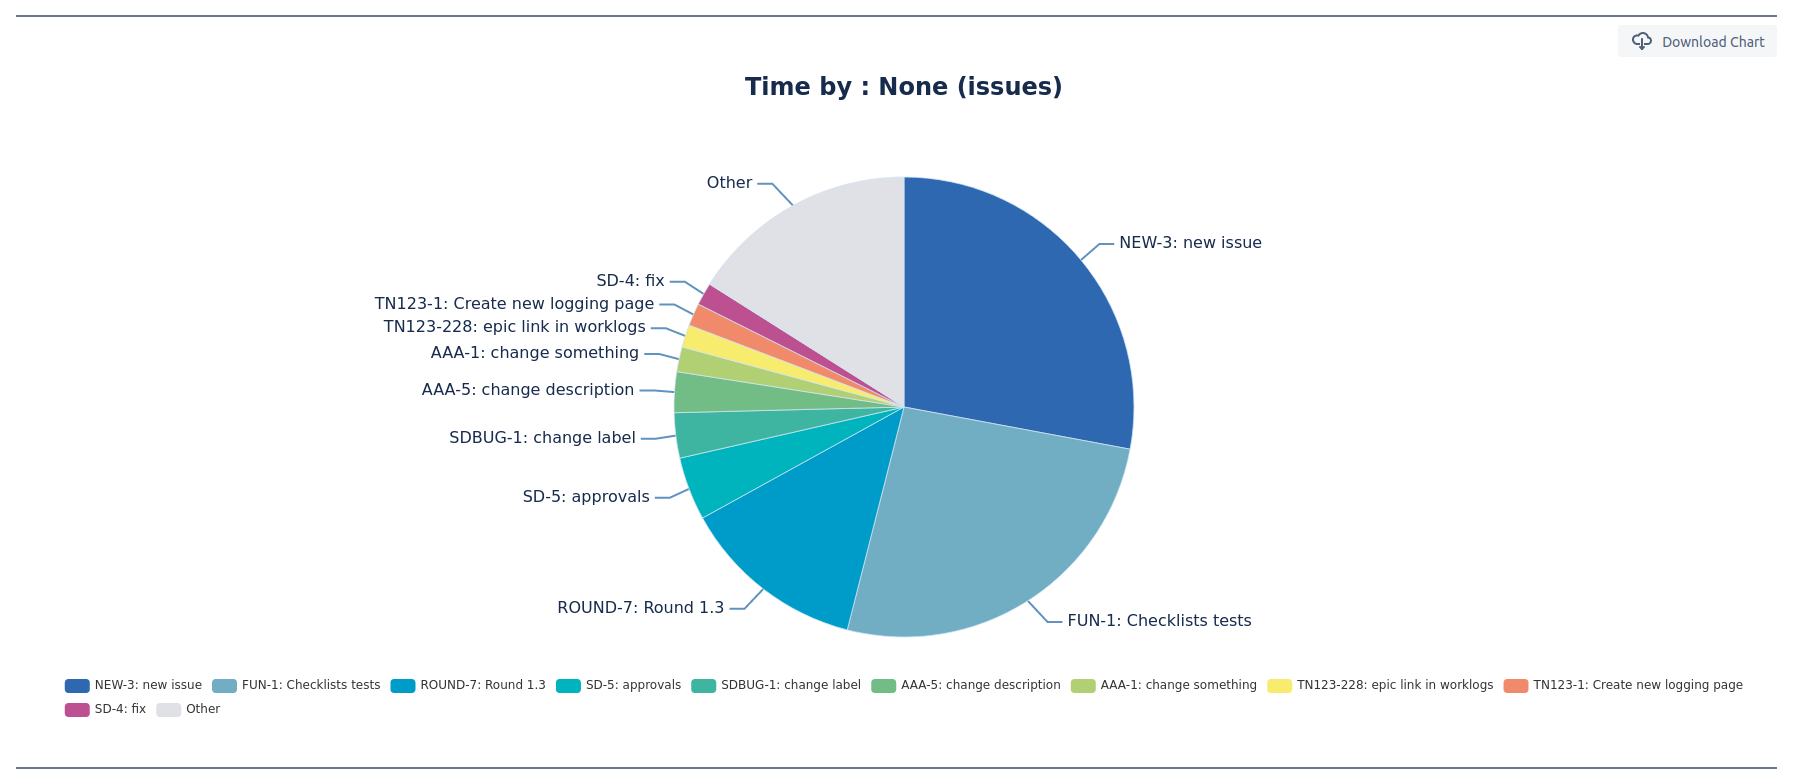
Pie chart allows you to visualize data on an interactive chart.
To prevent the chart from looking too cramped we recommend limiting the number of categories to the 10 biggest. Everything else will then end up in the ‘Other’ category. In addition, every value smaller than 1% also ends up there.
Bar chart
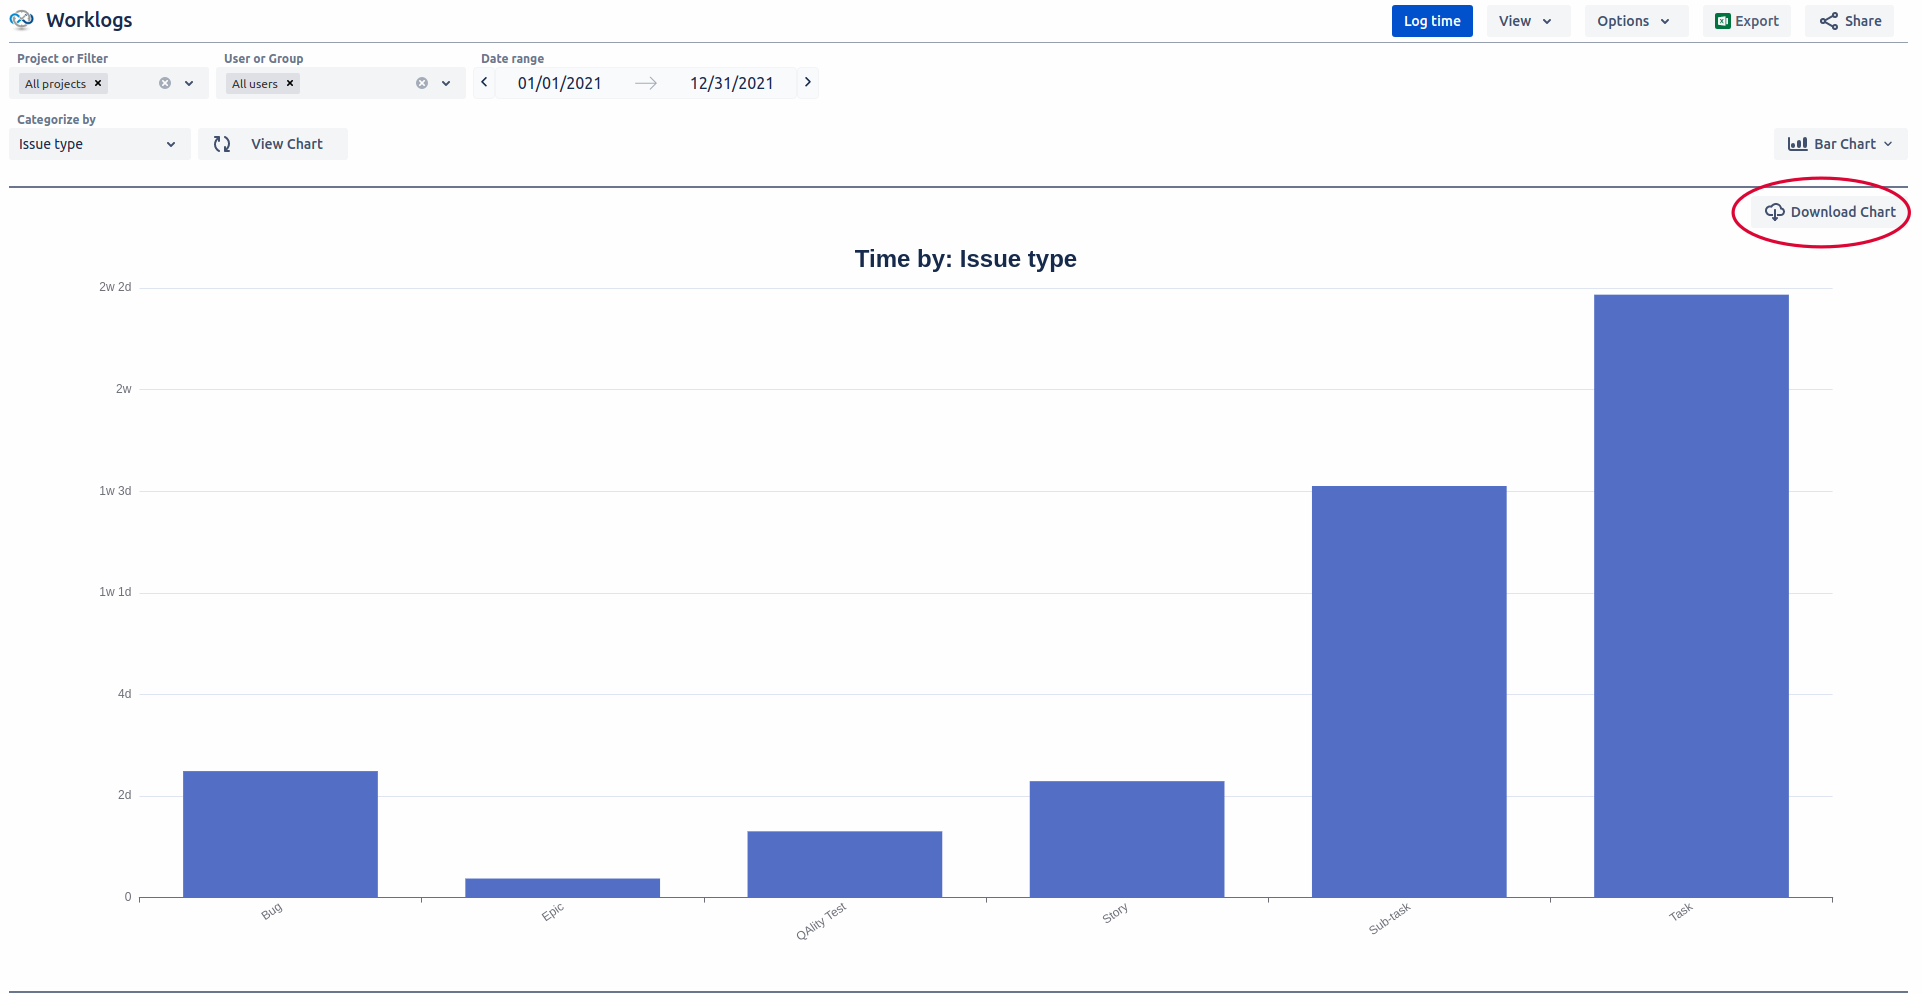
Similarly to pie charts, bar chart allows you to visualize data.
Download the generated chart
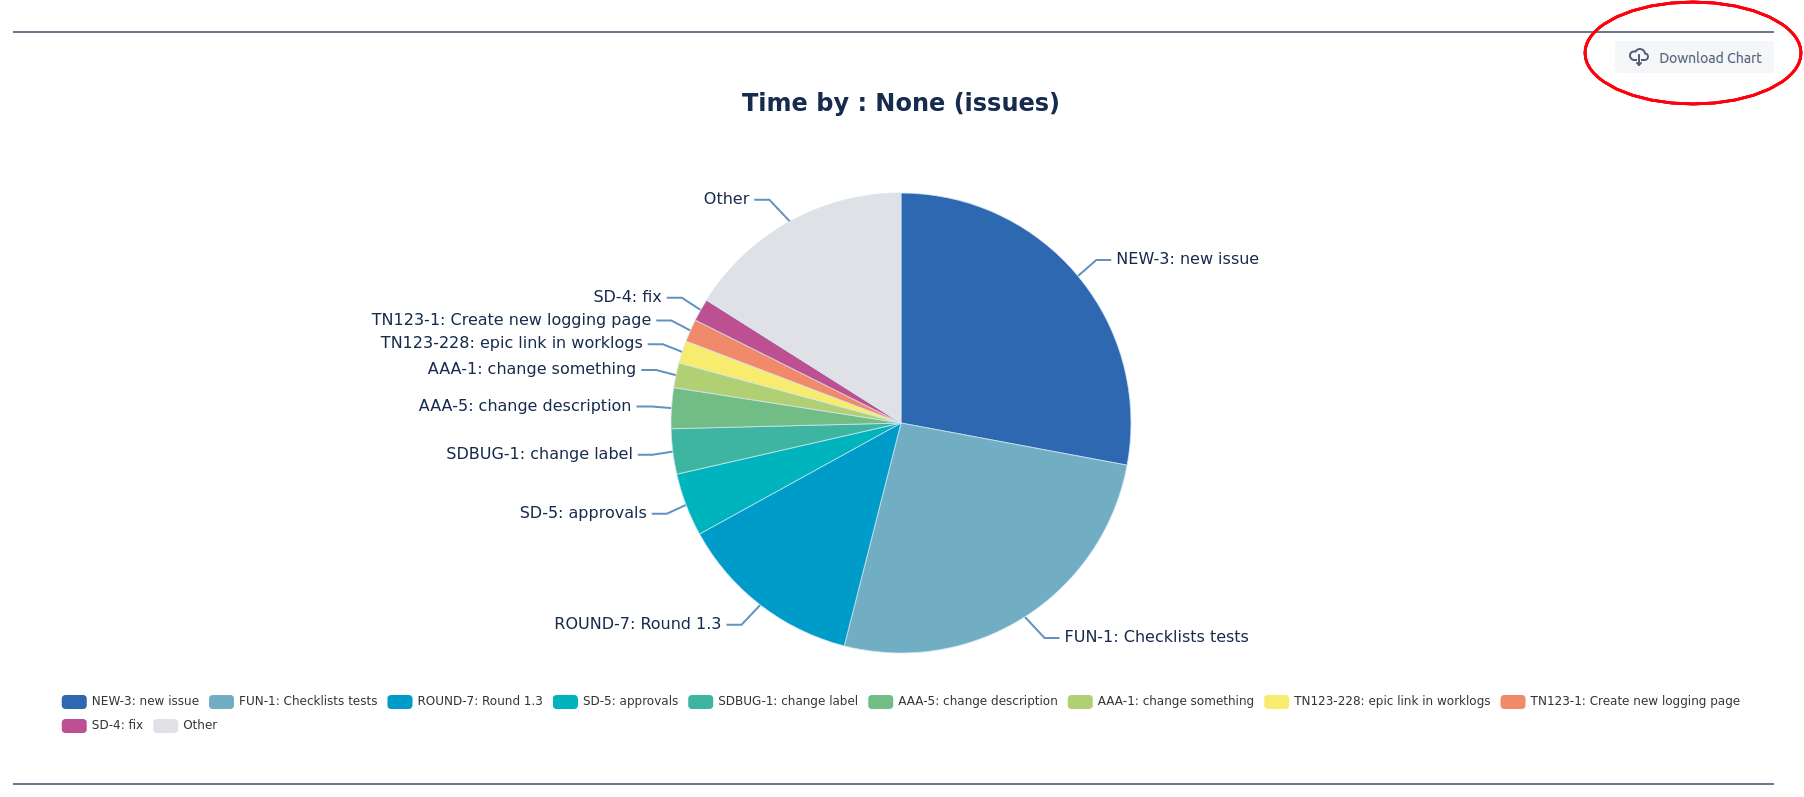
It is also possible to download the chart as a PNG file by clicking the download button next to the chart.
Do you have any questions or feedback? Feel free to contact us here 💡