
For a quick walkthrough of this feature, watch the video below 📽️.
Filtering and Grouping options allow you to display only those work logs you are interested in. Optionally, you can also categorize and summarize them by a Jira field of your choice. You could use grouping to learn, for example, how much time was spent on specific work types or projects.
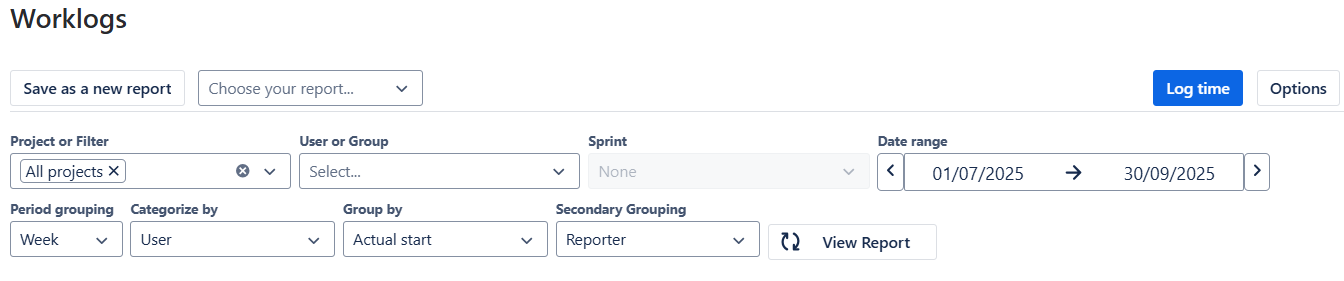
Data visibility & access rules
After generating or filtering a report, you might see messages about limited data. Worklogs always follows your global Jira permissions and will never show data you’re not allowed to see. For details, see App access rules.
Worklogs also respects all project-level permissions. If a user doesn’t have access to a project in Jira, worklogs from that project are automatically excluded from their reports. For details, see Project permissions impact.
Project or filter
For a quick walkthrough of this feature, watch the video below 📽️.
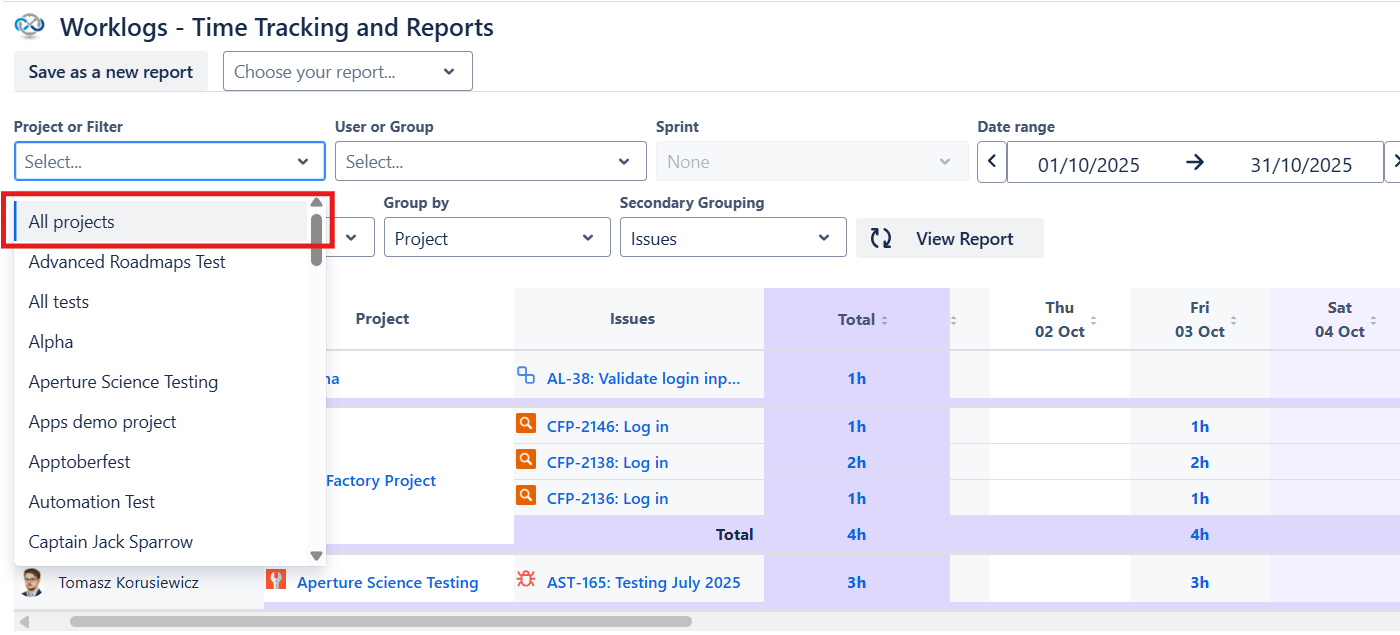
You can use this filter to display particular Jira spaces (projects) and/or work items (issues) that match certain JQL filters. You can add as many as you need. Worklogs will be displayed for work items (issues) that match at least one of the selected JQL filters.
When using the application on Server Hosting please add your filter to your favorites. Only then will the filter appear in the Worklogs app.
Additionally, if you want your filters to be visible to others you must remember to set the filter’s permission to be visible in your organization.
If you don’t need to limit the data shown in your table in any way, you can select All projects and see data from all spaces (projects).
User or group
For a quick walkthrough of this feature, watch the video below 📽️.
The ‘User or Group’ filter allows you to set Worklogs to display time logged by specific users or groups.
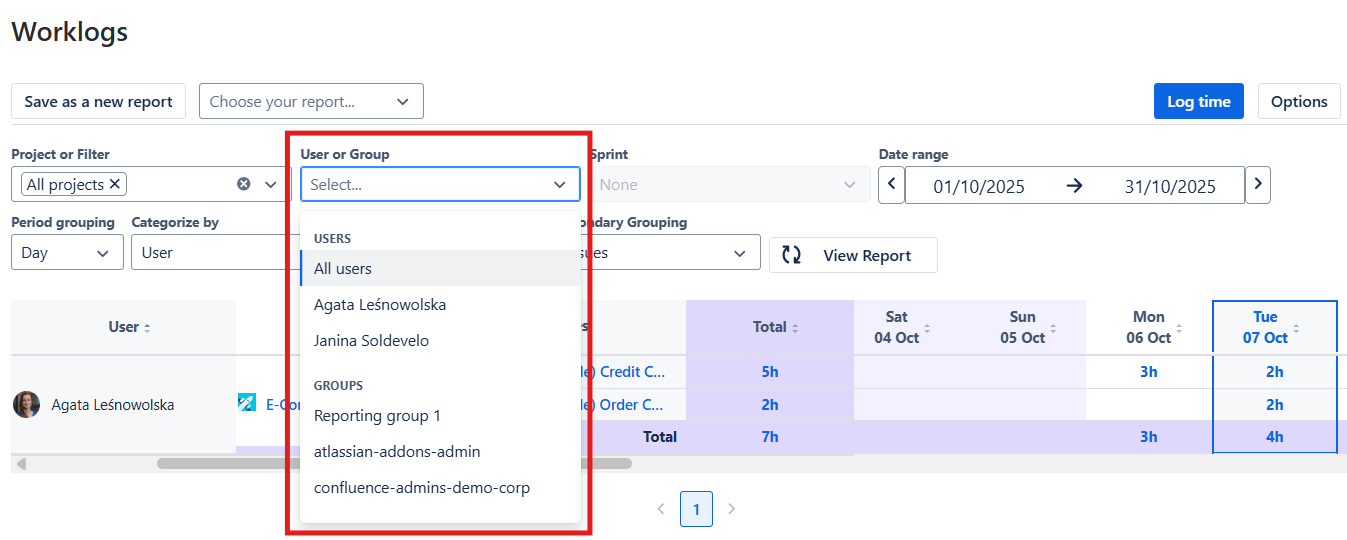
To learn how to create user groups in your Jira, please check this article.
Date range
For a quick walkthrough of this feature, watch the video below 📽️.
You can select a specific date range to display your work logs from a specific time period. You can also use one of the suggestions (today, current week, current month, current quarter, current year, previous week, previous month, previous 3 months, or previous quarter) by clicking on it.
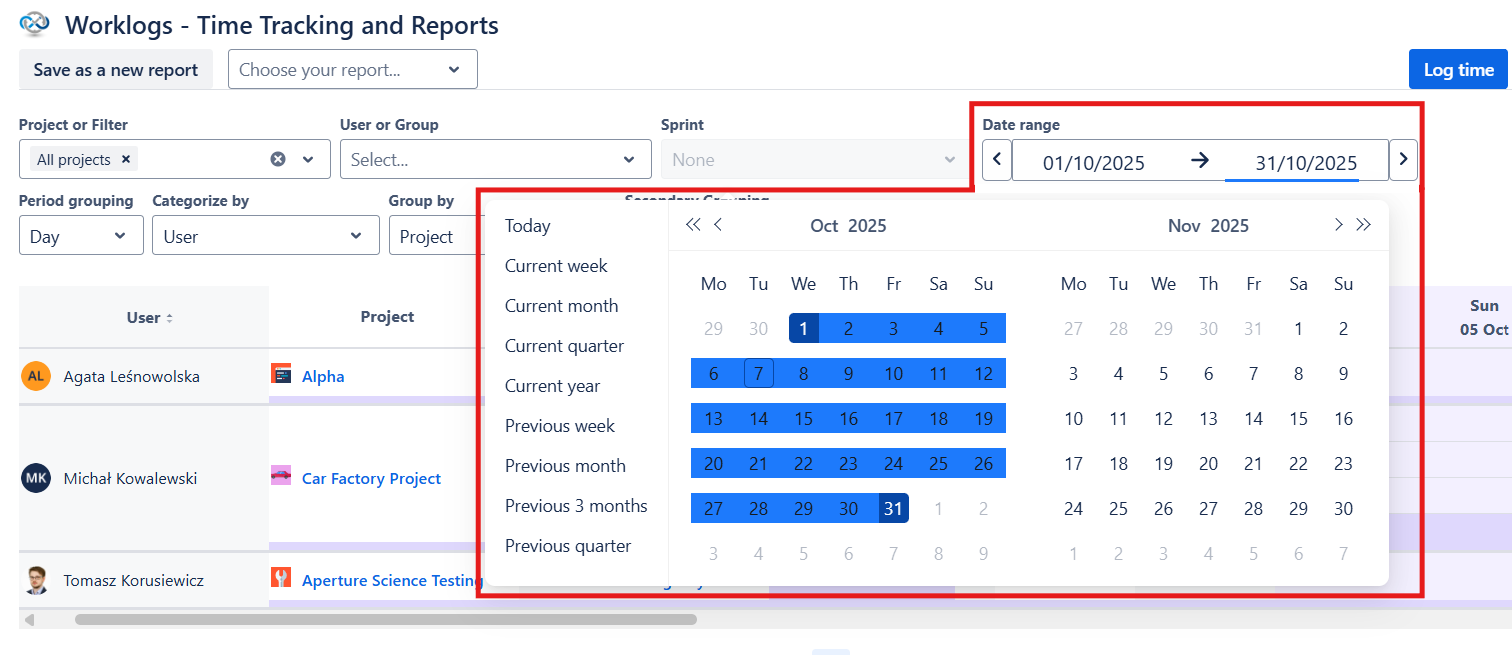
There are back and forward buttons you can use to jump between time periods. For example, if you set Worklogs to display weeks as time periods, the back button will allow you to switch to the previous week and the forward button will allow you to switch to the next week.
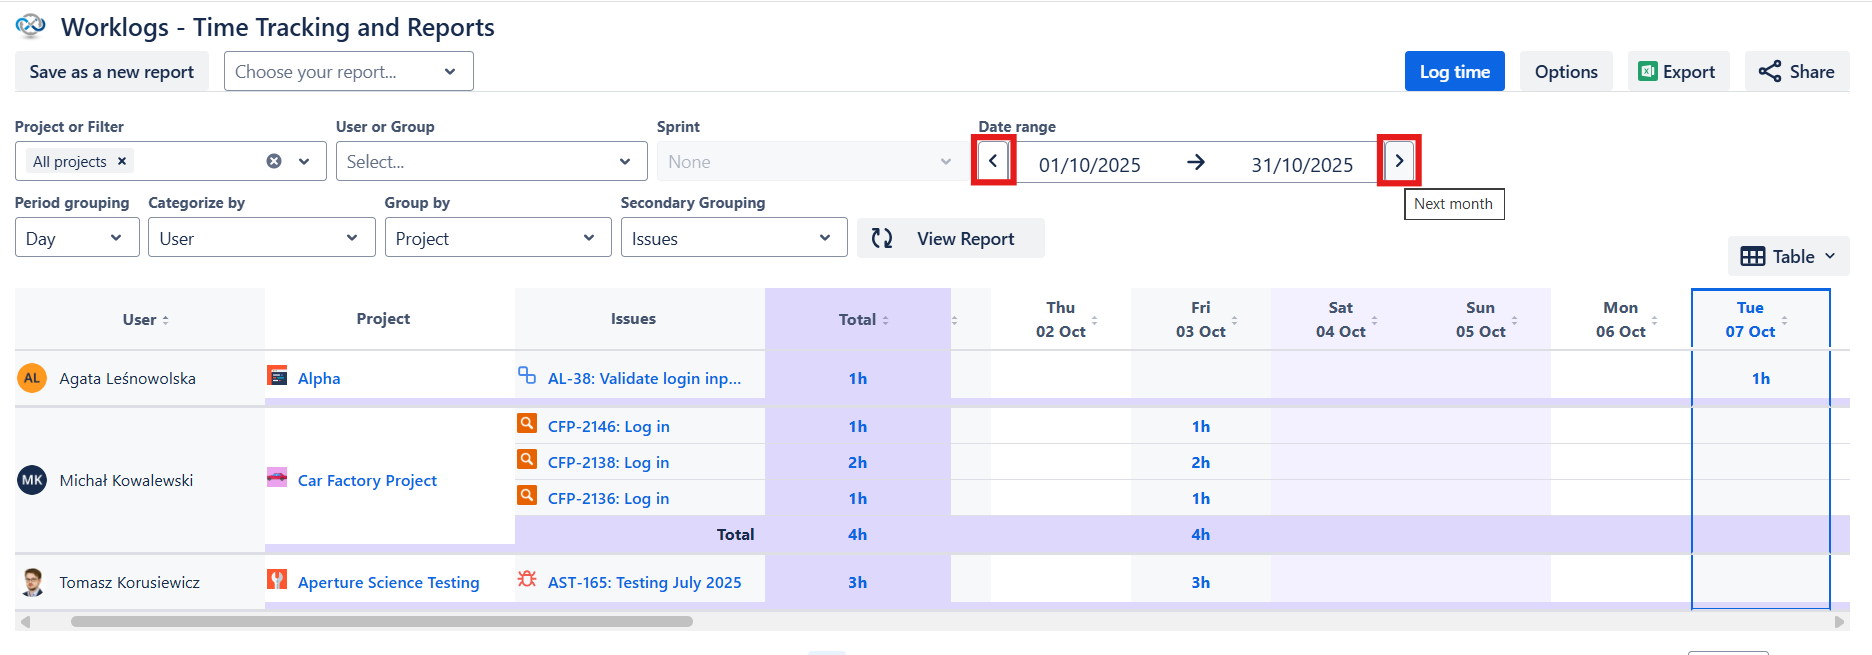
Tip: Worklogs supports dynamic date ranges, allowing saved reports to shift automatically over time to stay current. Learn more in Saving and managing reports
Sprint filter
For a quick walkthrough of this feature, watch the video below 📽️.
With the ‘Sprint' filter, you can display tickets assigned to a specific sprint.
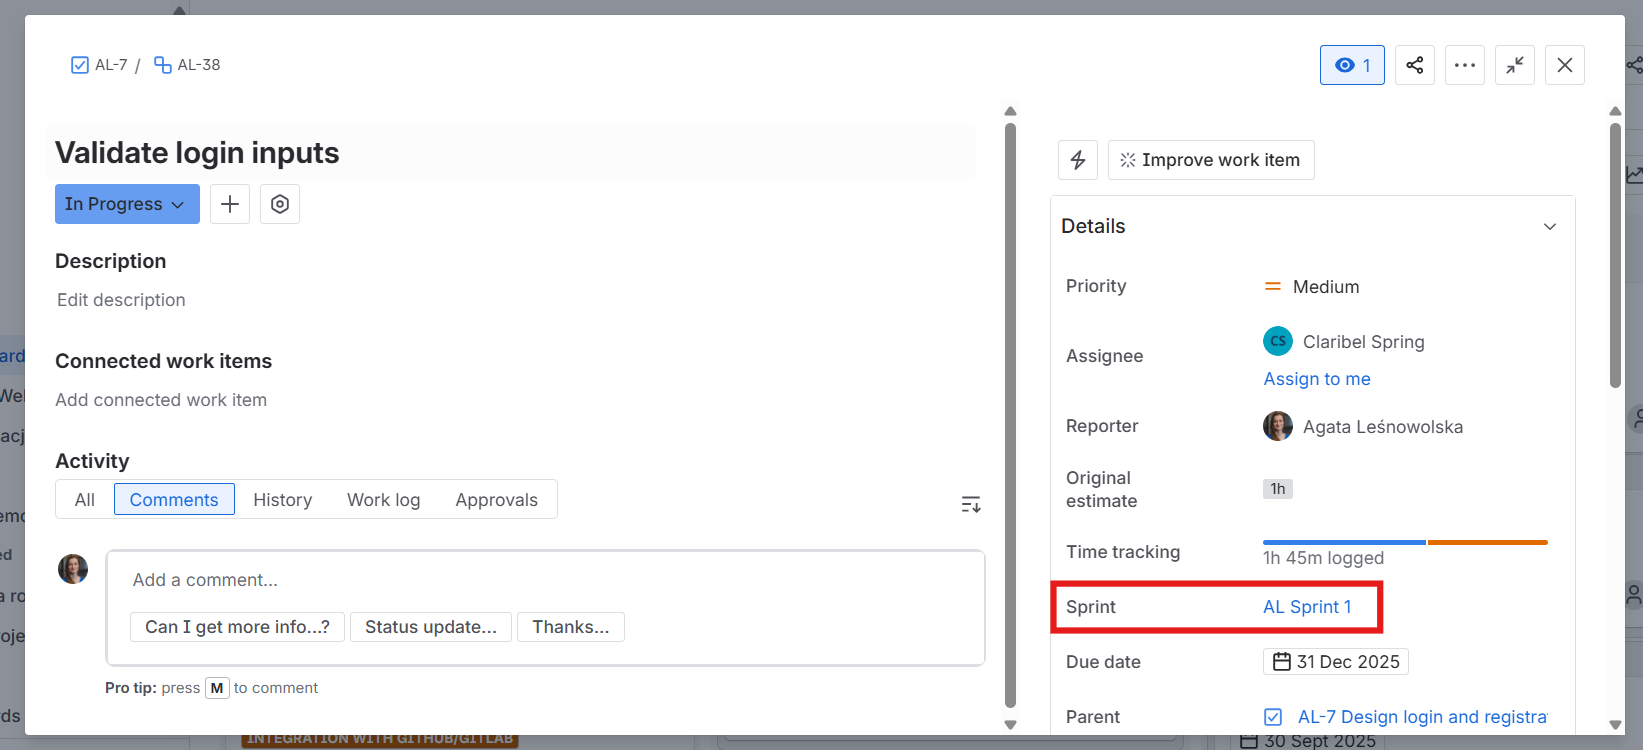
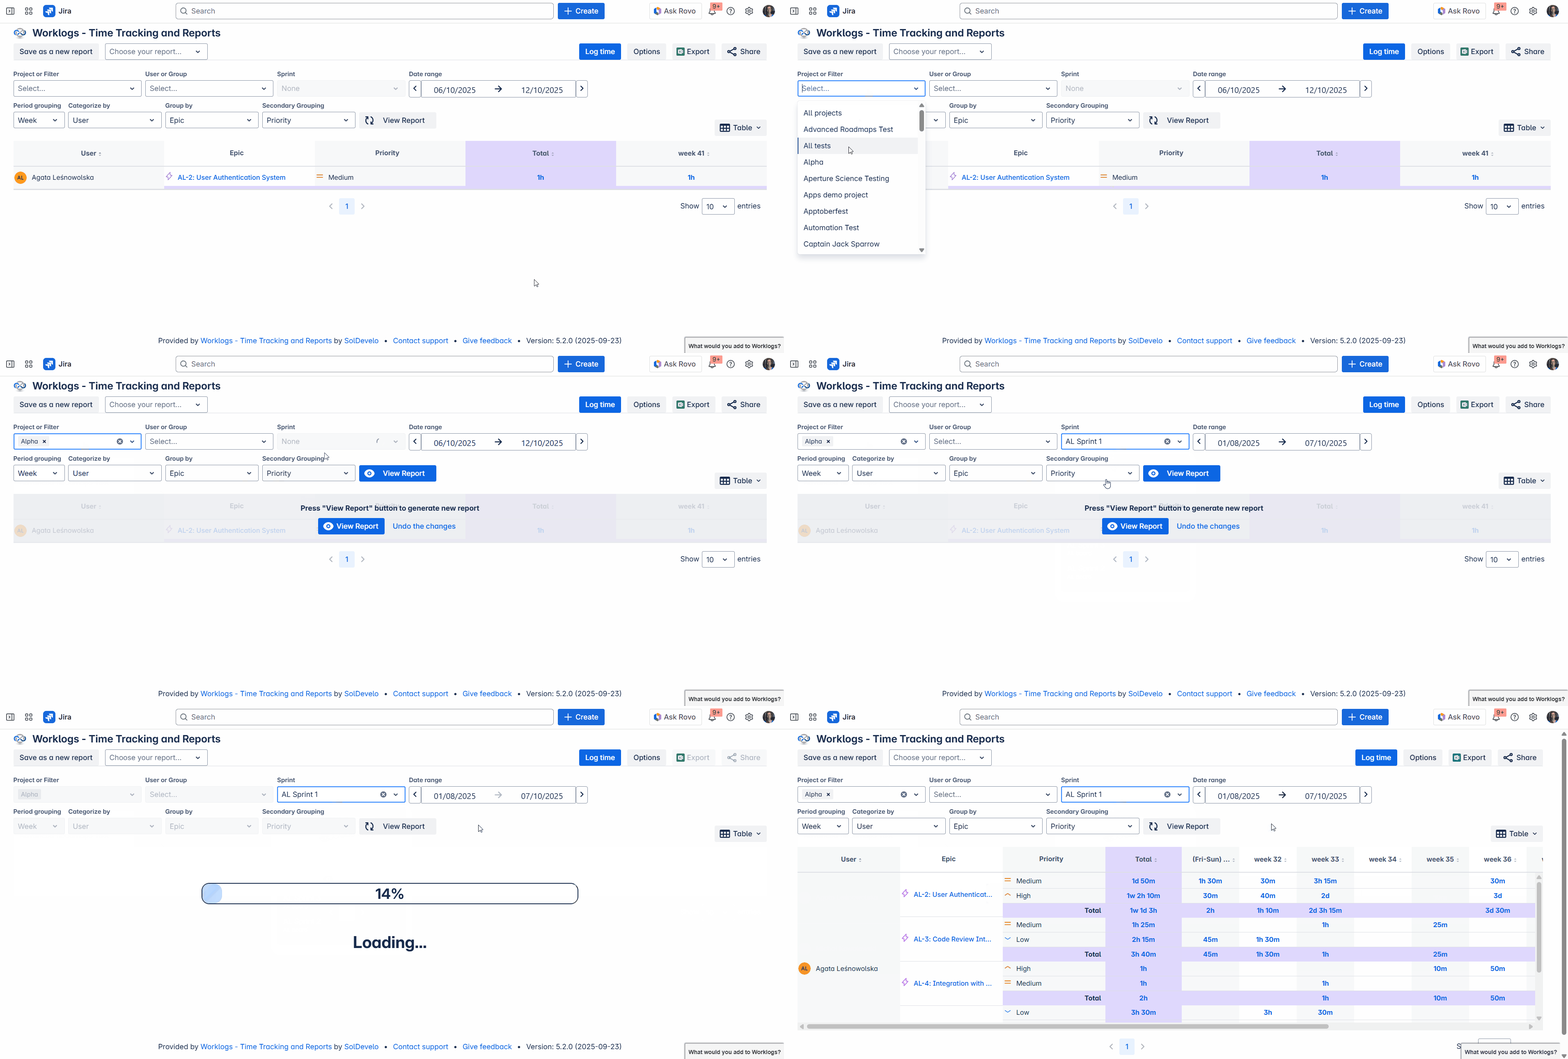
To use this filter, select a software development space (project) where sprints are enabled. Then, Worklogs will show you a drop-down list of all sprints from the selected space (project). Active sprints will always be at the top of the list. Click on the desired sprint to select it. The time frame will be automatically set according to the sprint’s start and end date. To see your time report, click View report.
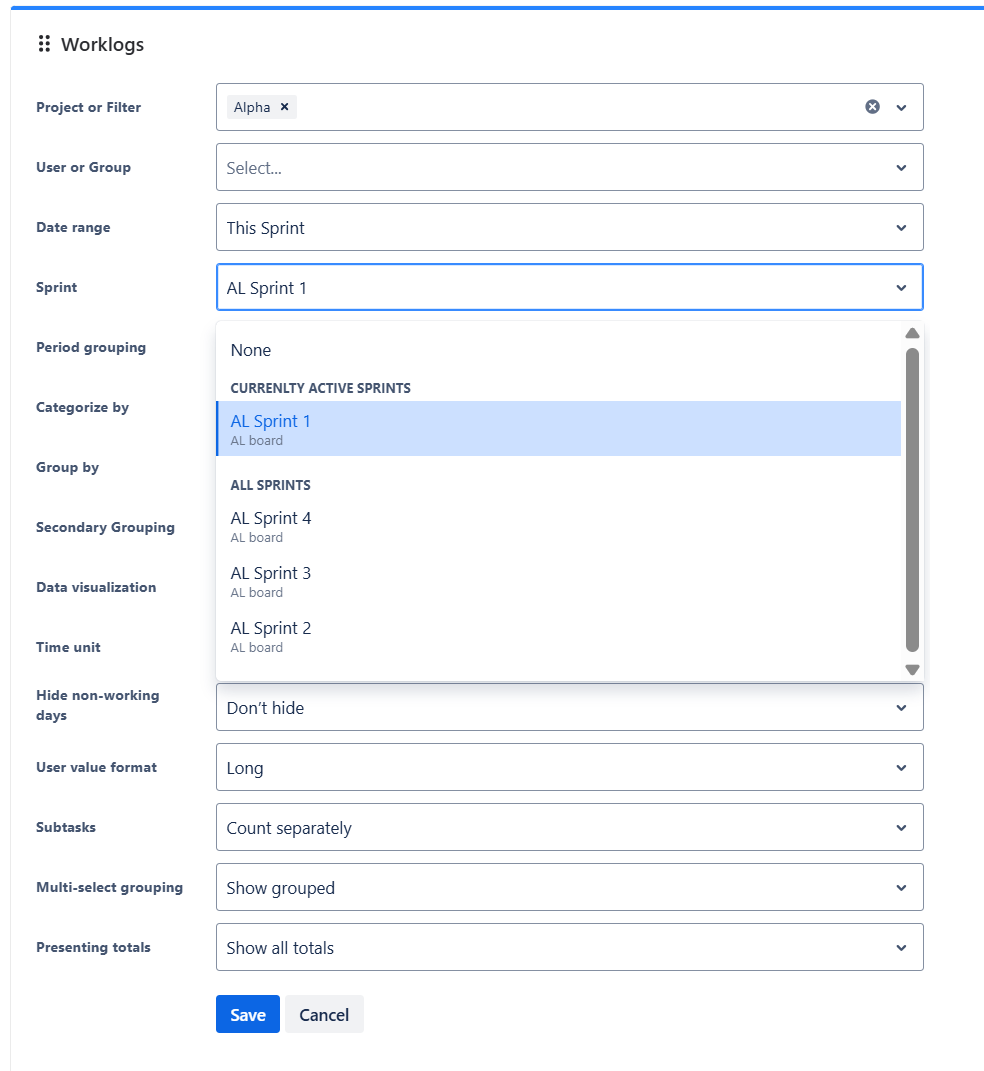
This filter is also available in dashboard gadget. In order to set it:
-
Open your dashboard with Worklogs added as a gadget.
-
Click Edit in the top right corner of the Dashboard.
-
Click the three-dot menu in the top right corner of the Worklogs gadget and select Configure.
-
Set the desired Software Development Project.
-
Choose the selected sprint.
-
Click Save.
You can select only one sprint filter. In case you would like to compare how much time each sprint took, use ‘Categorize by: Sprint’ and select the time range manually.
Period grouping
For a quick walkthrough of this feature, watch the video below 📽️.
The period grouping filter allows you to adjust the Worklogs table to show the logged time in days, weeks, months, or years. This gives you the flexibility to analyze not only what happens day to day but also how the trends change over a larger time span.
The ‘Period grouping’ updates automatically based on the selected date range. For instance, viewing Worklogs for the current year will change the grouping from ‘Day’ to ‘Month’. You may override this behavior by selecting a different grouping.
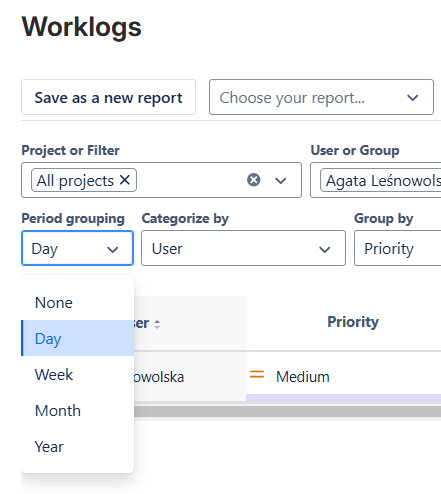
When ‘Period grouping’ is set to None, only total time values are shown - without any time breakdown.
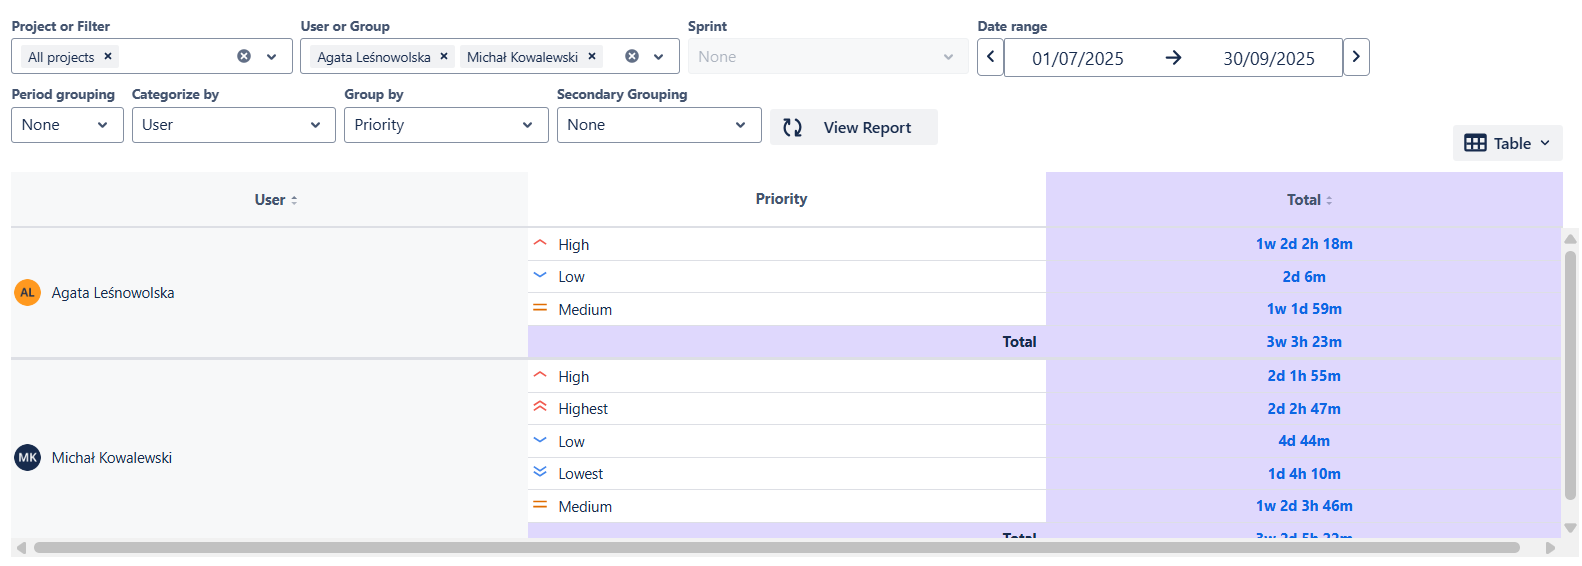
Categorization and grouping
The categorization and grouping options are based on Jira native fields and custom fields. You can find a list of all compatible field types.
Based on these fields, you can click and configure any hierarchy that fits your specific reporting needs. The system consists of three levels: ‘Categorize by’, ‘Group by’, and ‘Secondary Grouping’. Together, they allow you to break down your data into a detailed report.
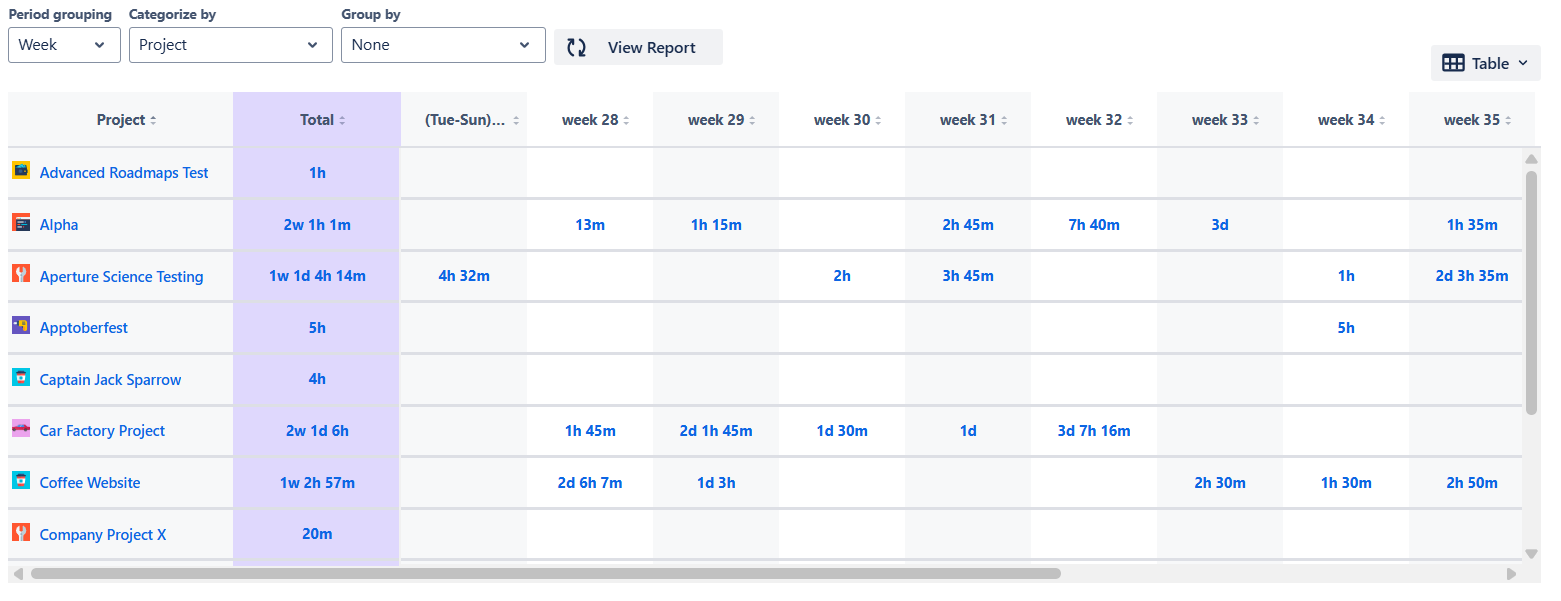
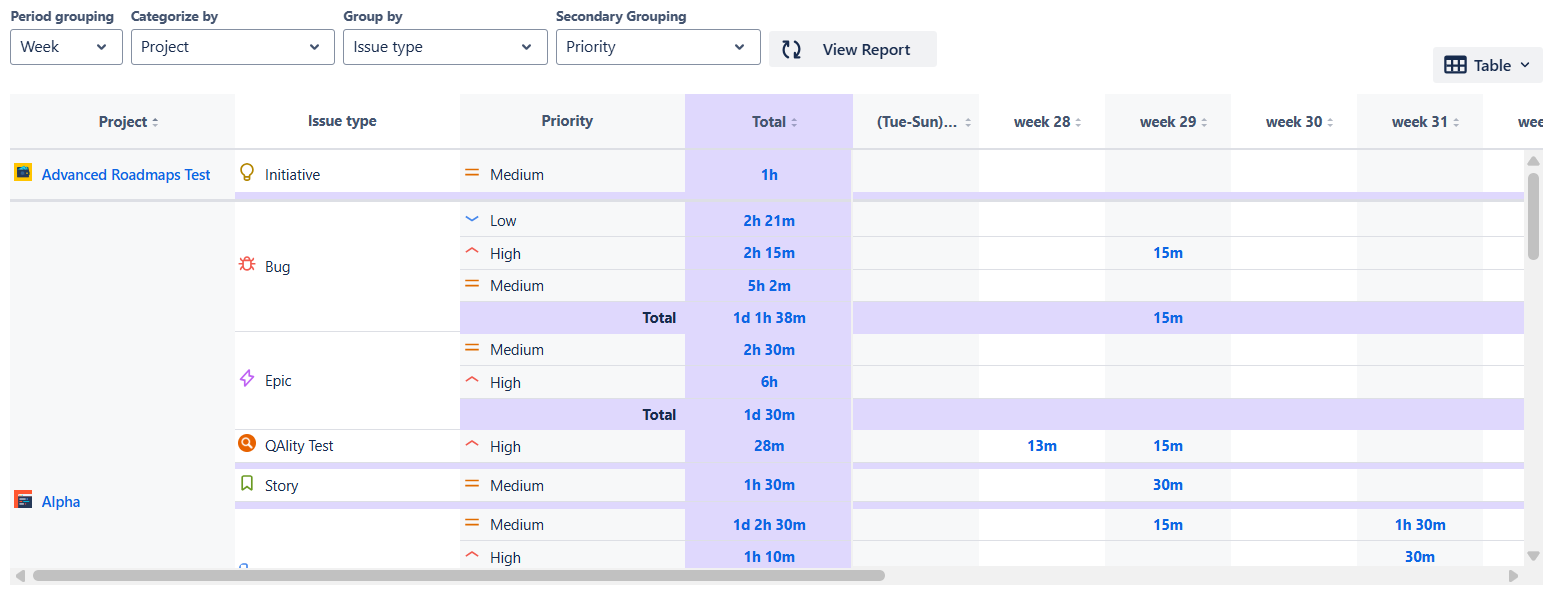
Imagine you’d like to learn how much time was spent on each of your projects. You can achieve this by setting ‘Categorize by’ to ‘Project’ as presented below.
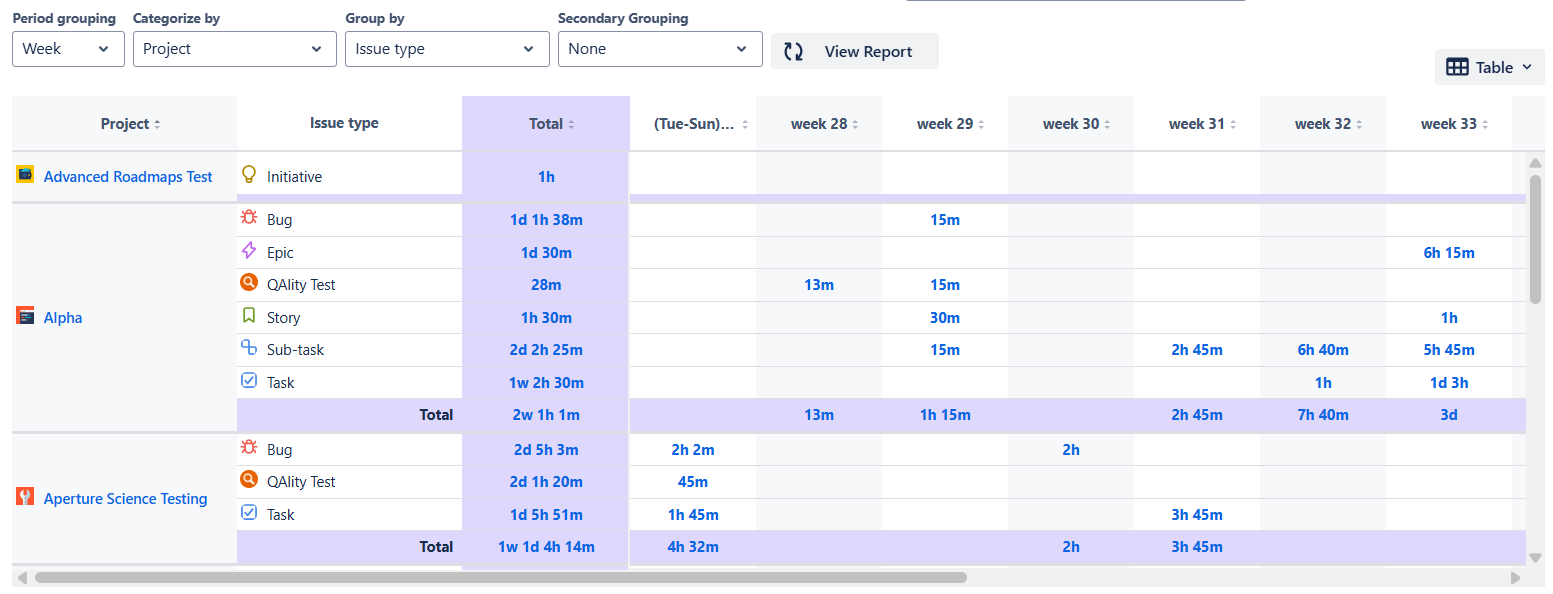
In addition to this, you might also want to learn how much time was spent on bug fixing, new stories, and epics. You could do that by additionally setting ‘Group by’ to ‘Issue type’ as shown. You can still see the total time spent per project, but you also get additional details on how it looks for each issue type in the project.
In the same manner, you can break down the details presented by the Worklogs table to the third level. In our example, by setting ‘Secondary grouping’ to ‘Priority’, we also learn for each project, and each issue type within those projects, how much time was spent on issues classified as high, medium, and low priority. ‘Secondary grouping’ is an optional field. You can leave it empty if you feel like it’s not necessary to use it.
In addition to Jira native and custom fields, you can also categorize, and group your reports by work log attributes - custom extra information attached directly to time entries (e.g., Billable status, Customer, Overtime, Work Type).
Attribute values appear alongside other fields in the 'Categorize by', 'Group by', and 'Secondary Grouping' dropdowns.
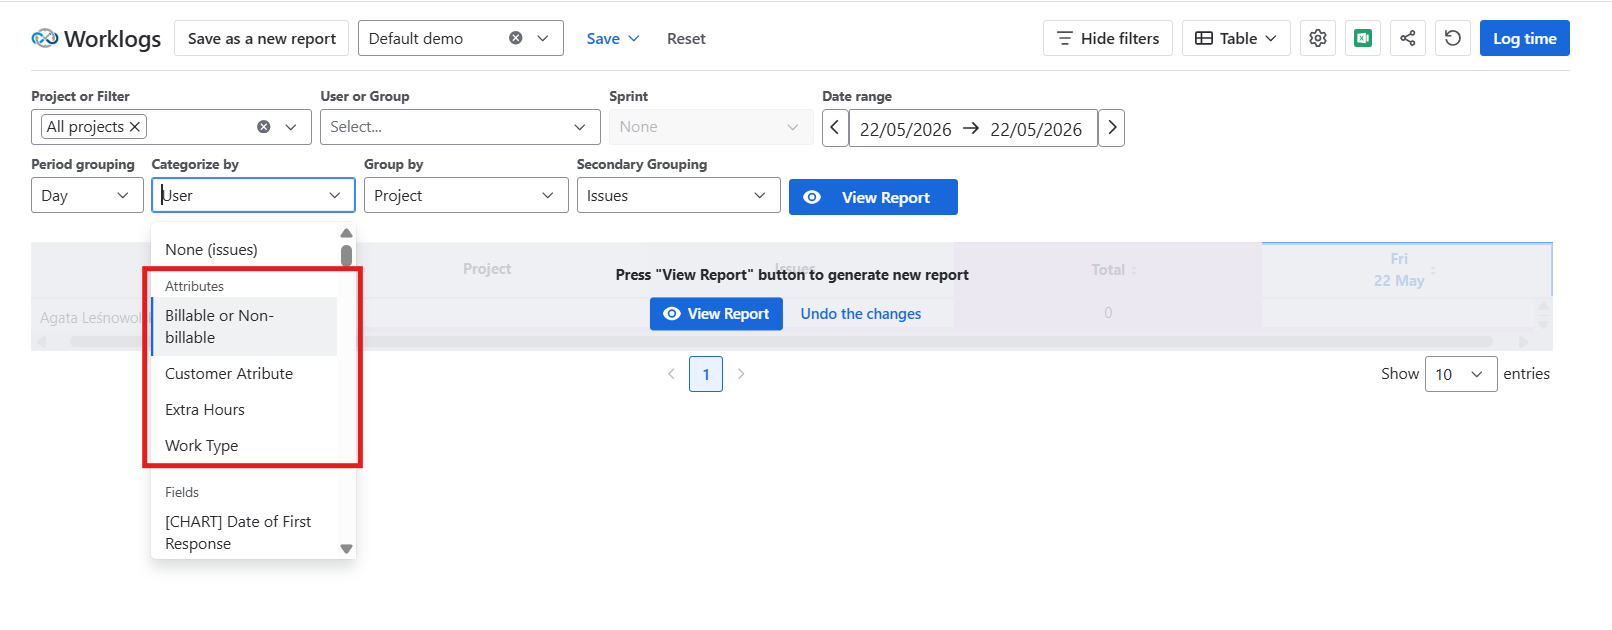
This means you can, for example:
-
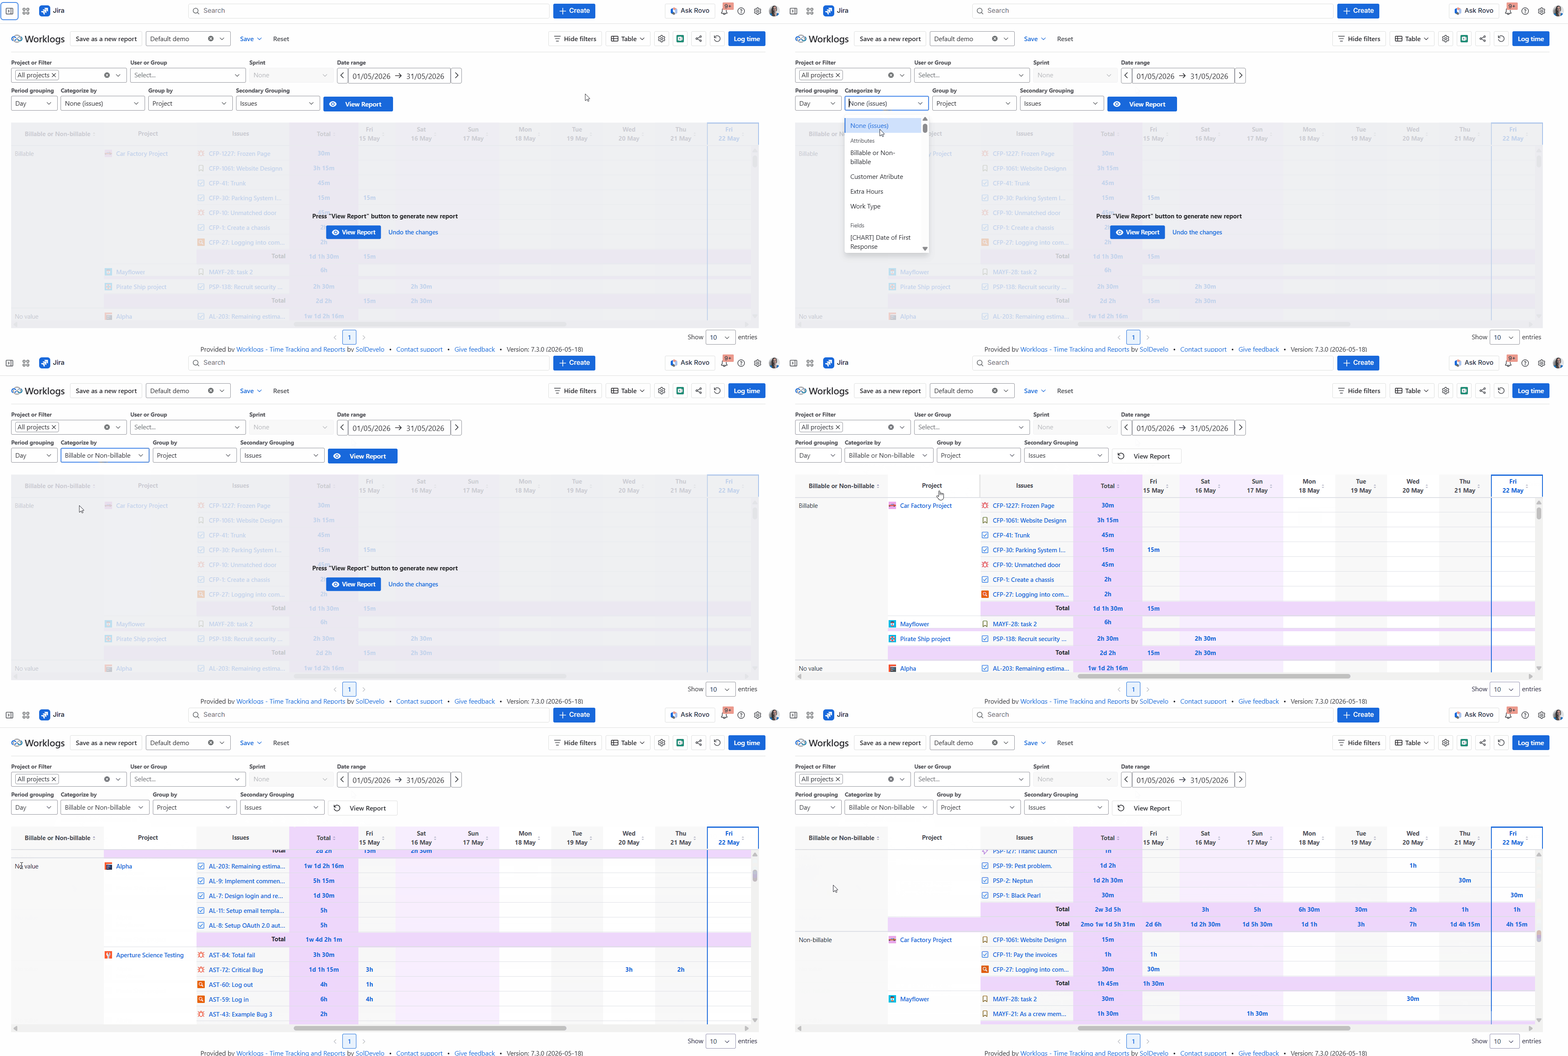
Categorize by Billable attribute to see how total logged time splits between billable and non-billable work.
-
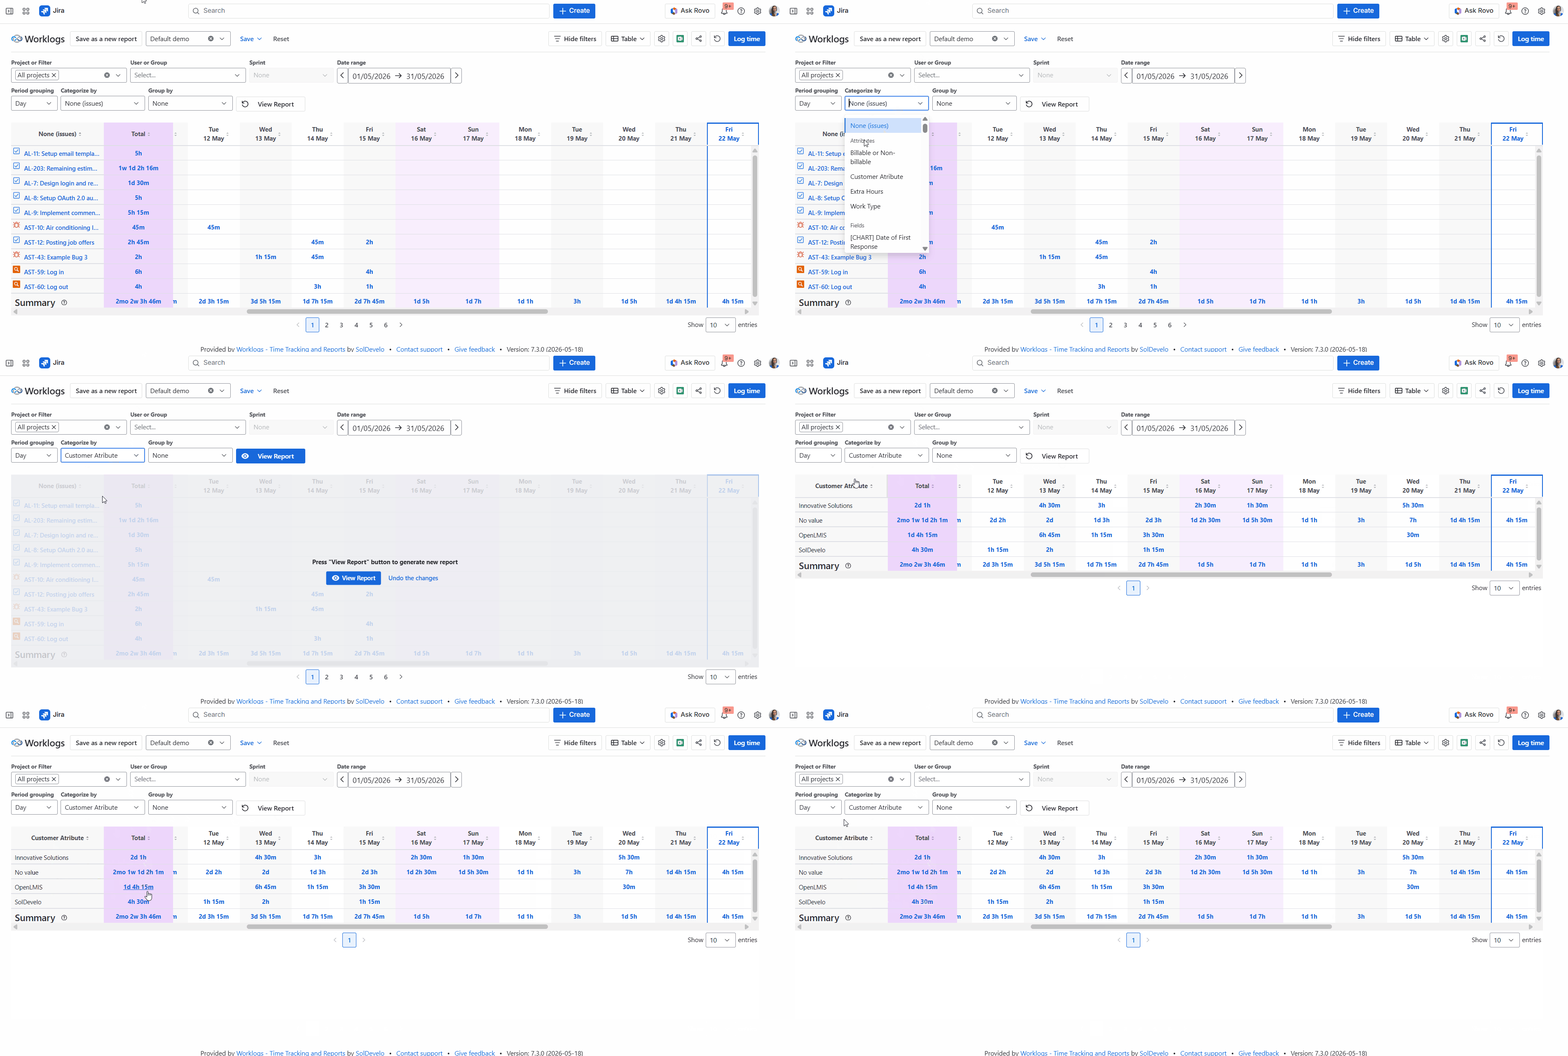
Categorize by Customer to understand how much time each client consumed.
-
Combine attributes with standard fields — for instance, categorize by Project, group by Issue type, and set secondary grouping to Work Type (Dev / QA / PM) for a full operational breakdown.
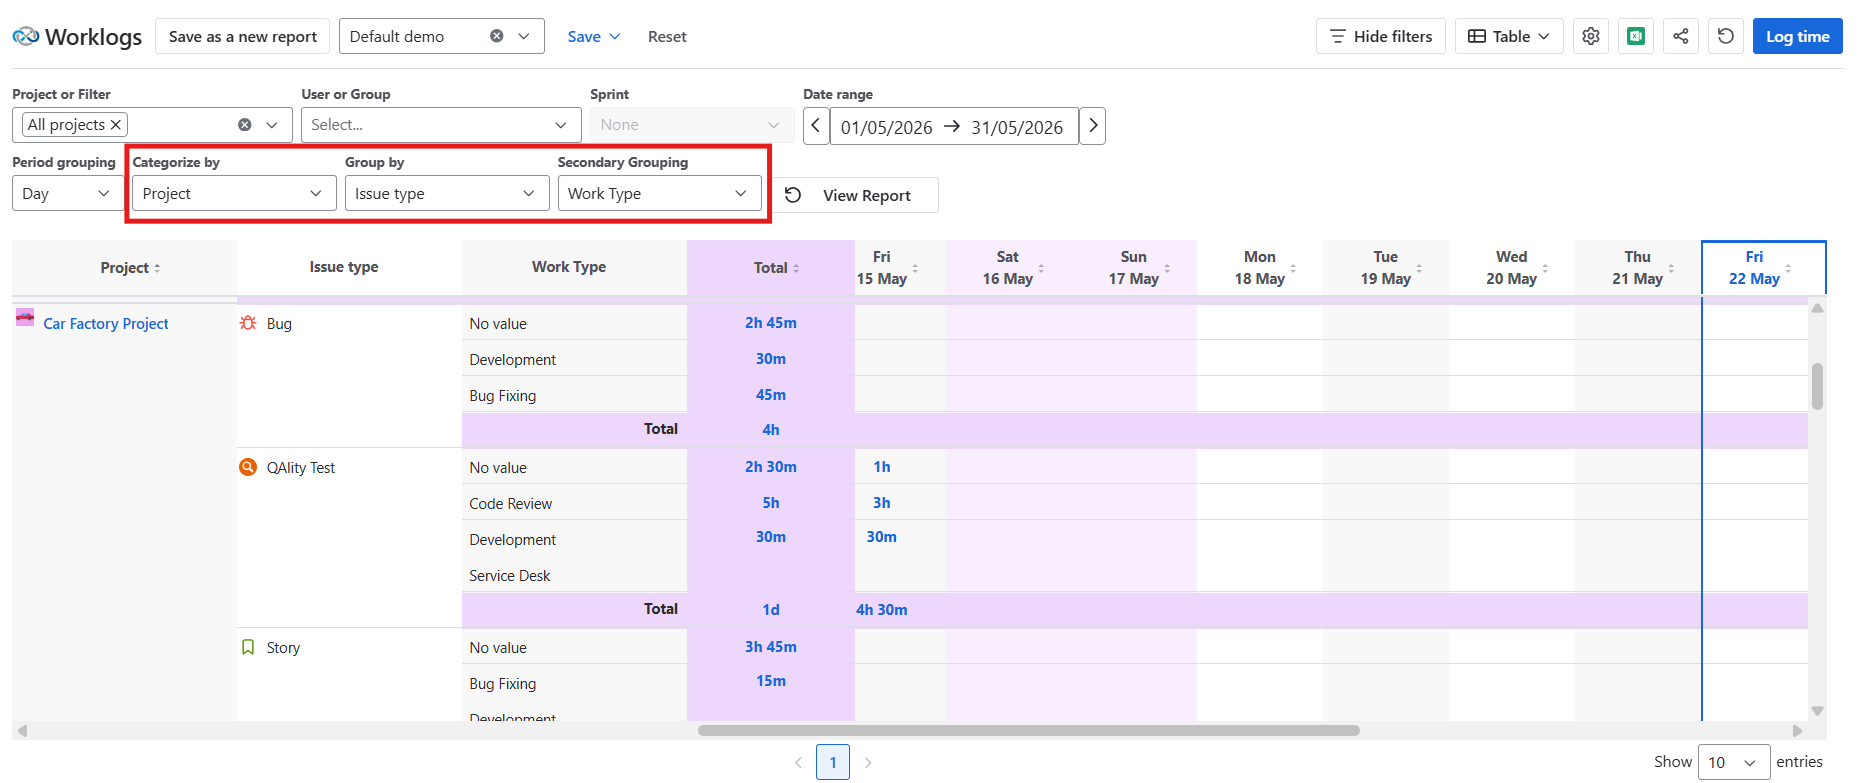
Attributes must first be configured by an admin, and the Worklogs Time Tracking Provider must be enabled. See Work log attributes for setup instructions.
In addition to filtering based on standard and custom fields, Worklogs, fully supports Advanced Roadmaps. This allows for deep integration with Jira’s hierarchy levels (such as Legends, Initiatives, and Epics). You can see more information in the Advanced Roadmaps section.
Reload data
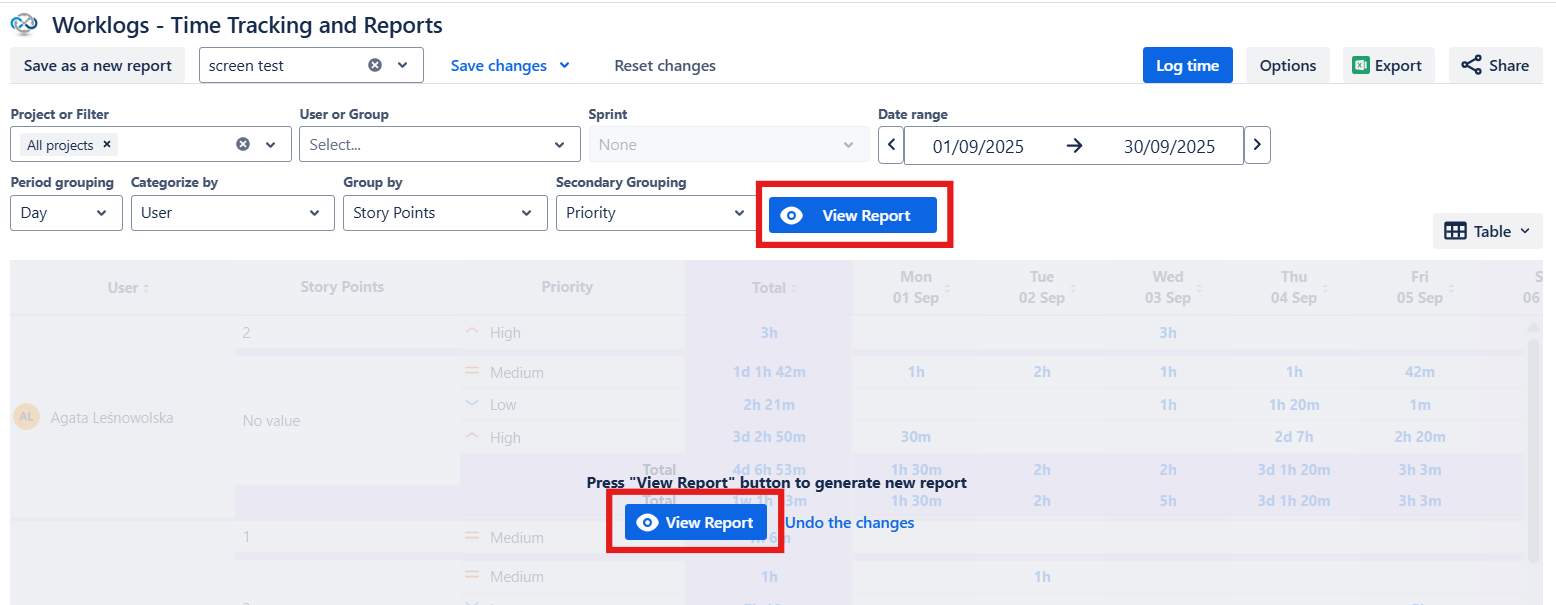
In order to generate the Worklogs report after making changes to the filters, date range, and/or grouping click the blue View report button.
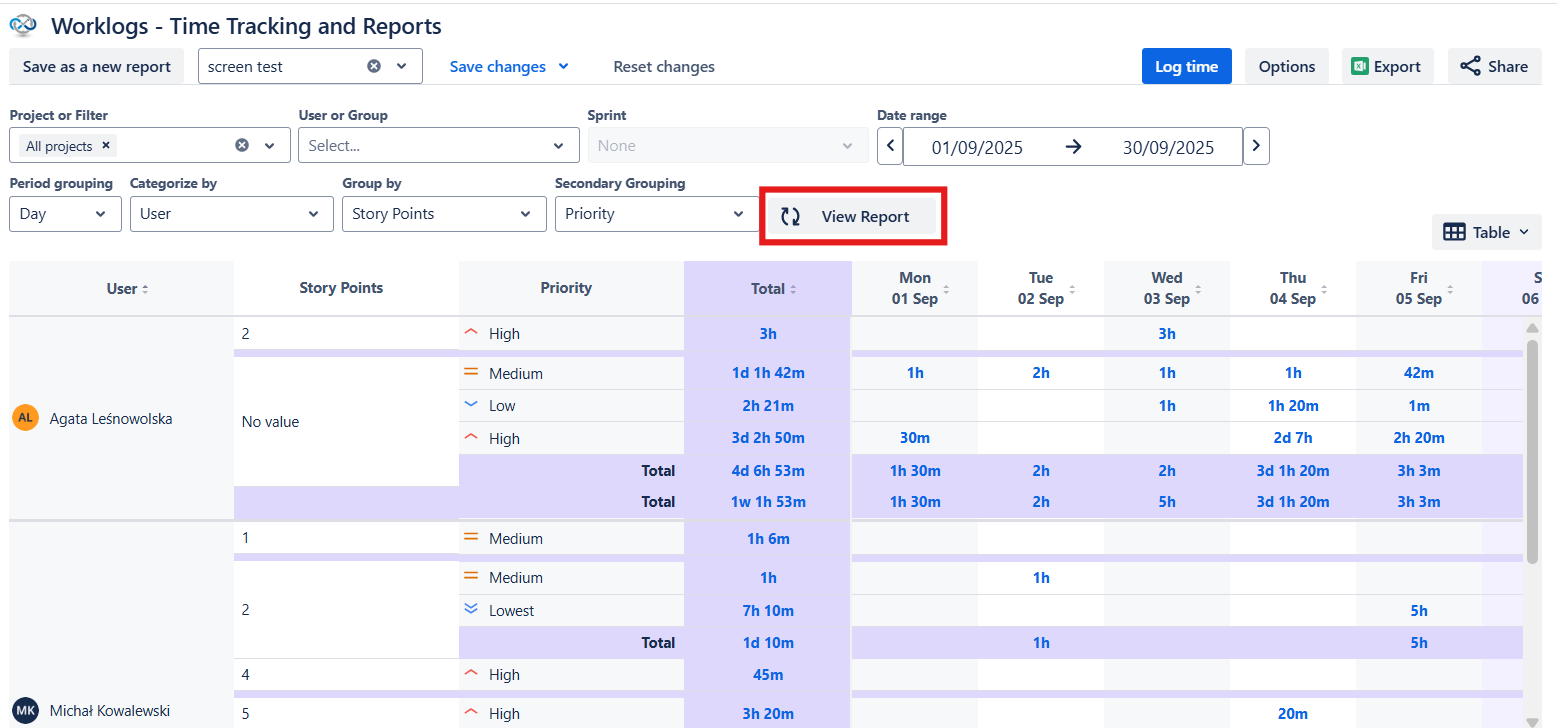
You can also refresh the data by clicking the same button in order to check if any new time was logged. The button will be gray to indicate that the filters, groupings, and date range haven’t changed.
Do you have any questions or feedback? Feel free to contact us here 💡